Law Firm KPI Dashboard Template
Track billable hours, realization rate, collection rate, utilization, and the other metrics that determine whether your law firm is actually profitable — not just busy.
What's Inside This Law Firm KPI Dashboard Template
This template includes 5 worksheets, each designed for a specific part of your law firm financial workflow:
KPI Dashboard
The main visual overview displaying your firm's critical performance metrics at a glance.
Attorney Timesheet
A structured weekly log for entering billable and non-billable hours by attorney and by matter type — litigation, transactional, advisory, and administrative.
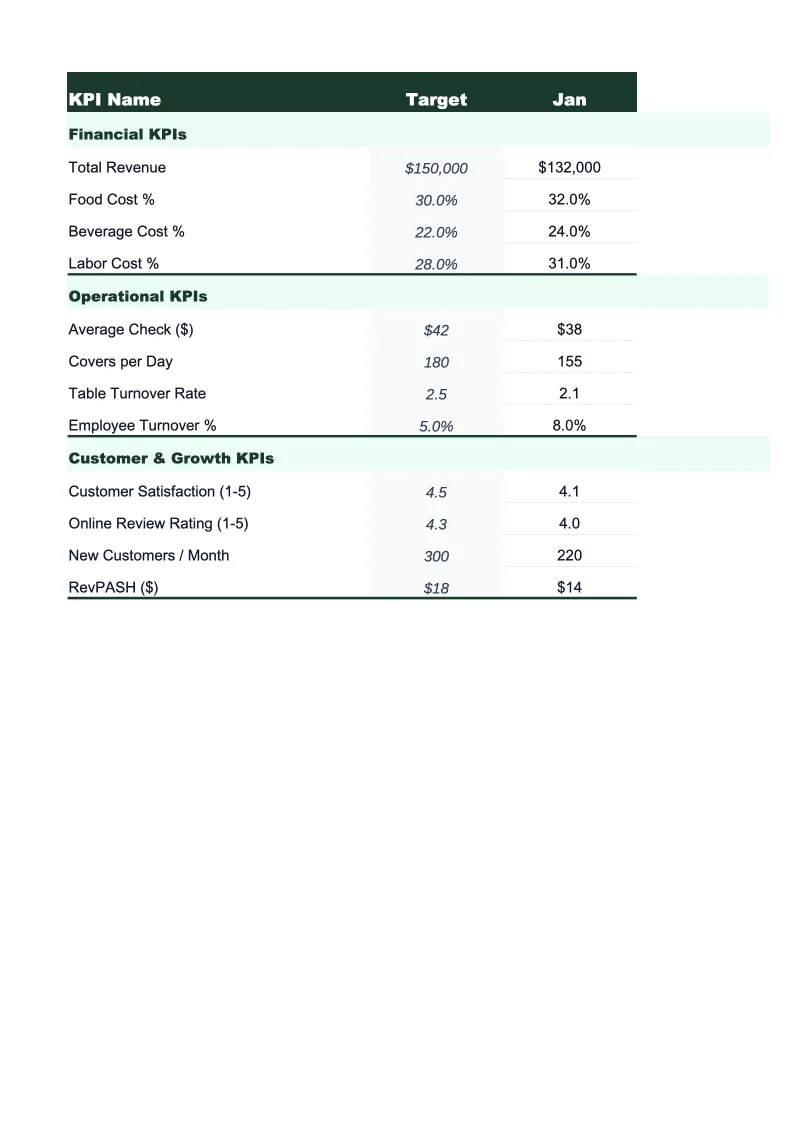
Monthly Scorecard
Set your targets for each KPI at the start of the month, then enter actuals as you close the month.
Matter Profitability
A matter-by-matter profitability tracker that shows budgeted vs.
12-Month Trends
A rolling 12-month view of your most important KPIs plotted as line charts.
Law Firm KPI Dashboard Features
- 22 pre-loaded law firm KPIs including realization rate, collection rate, and utilization
- Color-coded status indicators — green/yellow/red against your monthly targets
- Weekly attorney timesheet with billable vs. non-billable tracking by matter type
- Matter profitability tracker comparing budgeted vs. actual hours and fees
- 12-month trend charts for billable hours, realization rate, and collection rate
- Write-off and write-down tracking with rate calculations for profitability analysis
How to Use This Law Firm KPI Spreadsheet
Start with the Monthly Scorecard tab and enter your targets for the month. If you don't have formal targets yet, use the benchmark ranges pre-loaded in the template — billable hour targets, realization rate thresholds, and collection rate benchmarks are drawn from industry data so you have a real baseline from day one. Most firms set billing targets by practice area and seniority level; the scorecard has rows for both firm-level and attorney-level targets. Initial setup takes about 20 minutes.
Log attorney hours in the Timesheet tab weekly — daily logging is ideal but weekly works if you're building the habit. Enter each attorney's billable and non-billable hours by matter type. The formulas calculate utilization rate and flag attorneys who are tracking below their monthly target with enough time to course-correct before the month closes. Update the Matter Profitability sheet as matters progress, especially for flat-fee and capped matters where budget overruns have direct profitability implications.
15 minutes from download to your first KPI review
Download the template, enter your targets, and start tracking the metrics that determine whether your firm is performing at full potential.
Why Every Law Firm Needs a KPI Dashboard
Law firms run on three numbers that most managing partners know instinctively but few track with any rigor: billable hours, realization rate, and collection rate. A firm billing 1,800 hours per attorney per year at $300/hour looks like it should produce $540,000 in revenue per lawyer — but if realization rate is 85% (write-offs and write-downs reduce collected fees to 85% of billed), and collection rate is 90% (10% of invoiced amounts go uncollected), actual collected revenue per lawyer is closer to $412,000. That gap between theoretical and actual is where most firms lose money without knowing it, and it's exactly what a KPI dashboard makes visible.
The KPIs that matter most in law firm management fall into three categories. Productivity metrics: billable hours per attorney and utilization rate (billable hours as a percentage of available hours) measure whether the firm's human capital is being used effectively. Target utilization is typically 1,600–1,900 billable hours per year for associates and 1,400–1,700 for partners, depending on firm type. Profitability metrics: realization rate (fees collected versus fees worked) and matter profitability reveal whether pricing is right and whether write-offs are eroding margins. Collection metrics: collection rate, time-to-bill, and AR aging tell you whether cash flow is healthy or whether working capital is being consumed by slow-paying clients. A healthy firm should target 90%+ realization and 95%+ collection rate; most underperforming firms have problems in one or both.
Law Firm Industry at a Glance
Financial templates built for law firms and legal practices — from solo practitioners to mid-size firms. Pre-loaded with billing rate structures, matter tracking, and trust account categories.
Revenue Drivers
- Billable hours (hourly engagements)
- Flat fee matters
- Retainer agreements
- Contingency fee recoveries
Key Cost Categories
- Attorney compensation & draws
- Paralegal & staff salaries
- Malpractice insurance
- Legal research subscriptions (Westlaw, LexisNexis)
- Office rent & overhead
- Bar dues, CLE & licensing
Typical Margins
Gross: 40-60% · Net: 15-35%
Seasonality
Q4 typically busiest for transactional and corporate practices (year-end deals); litigation practices are more event-driven. January is slower across most practice areas.
Key Performance Indicators
Law Firm KPI Dashboard FAQ
More Law Firm Templates
Law Firm Balance Sheet Template for Excel
$29
Law Firm Budget Template for Excel
$29
Law Firm Business Plan Template for Excel
$39
Law Firm Cash Flow Template for Excel
$29
Law Firm Expense Tracker Template for Excel
$29
Law Firm Financial Model Template for Excel
$29
Law Firm Income Statement Template for Excel
$29
Law Firm Invoice Template for Excel
$29
Law Firm P&L Template for Excel
$29
Law Firm Pro Forma Template for Excel
$29
Law Firm Project Budget Template for Excel
$29
Law Firm Sales Forecast Template for Excel
$29
Law Firm Valuation Template for Excel
$29
More KPI Dashboard Templates
Law Firm KPI Dashboard Template
$29