Law Firm Financial Model Template
Model billable hours by attorney, track realization and collection rates, and forecast your law firm's revenue, expenses, and cash position — built for solo practitioners and small firms managing multiple practice areas.
What's Inside This Law Firm Financial Model Template
This template includes 6 worksheets, each designed for a specific part of your law firm financial workflow:
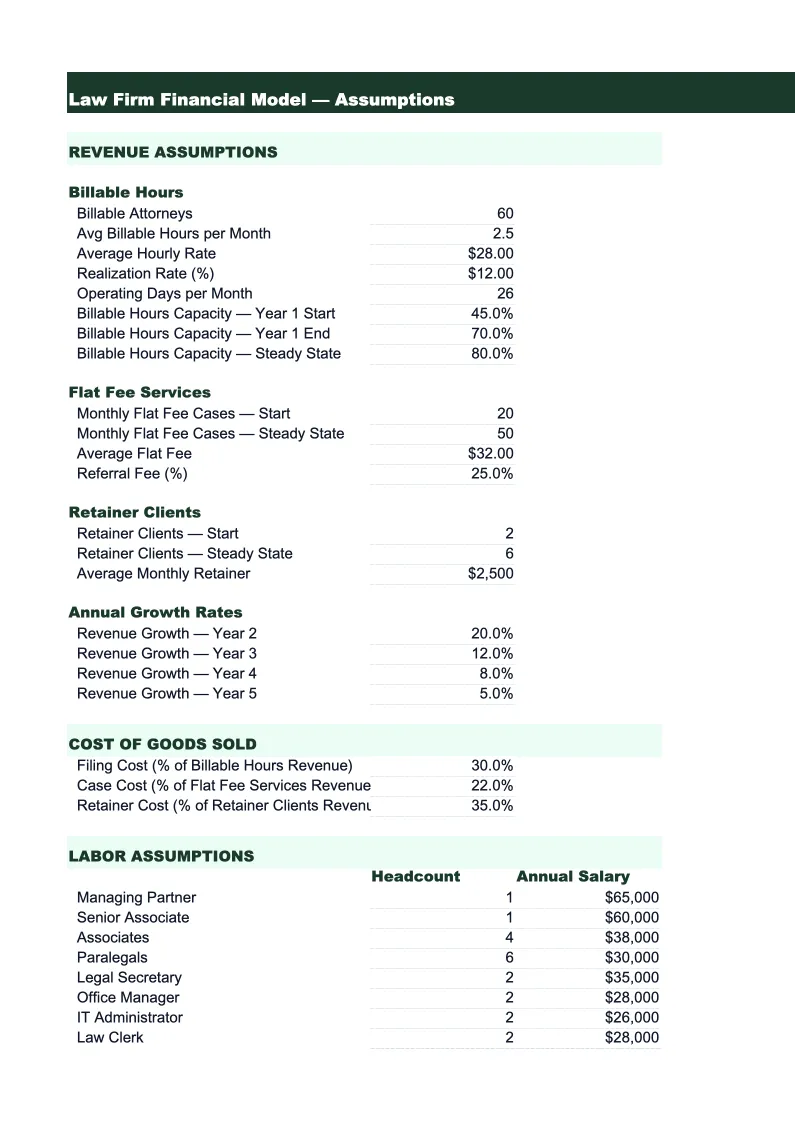
Assumptions
The central input sheet that drives every projection in the model.
Revenue Model
A 24-month revenue projection organized by billing structure and practice area.
Utilization & Realization
The core performance tracking sheet that maps the three key metrics law firm economics depend on: utilization rate (billable hours ÷ available hours), realization rate (hours billed ÷ hours worked), and collection rate (cash collected ÷ amounts billed).
P&L
A 24-month profit and loss statement that starts with gross billings, applies realization and collection adjustments to arrive at net revenue, then deducts all operating expenses.
Cash Flow
A monthly cash flow statement that accounts for the timing gap between when legal work is performed, when it is billed, and when clients actually pay.
Dashboard
A one-page visual summary designed for partner meetings, bank reviews, or annual planning sessions.
Law Firm Financial Model Template Features
- Revenue model split by billing structure: hourly, flat-fee, retainer, and contingency projected separately
- Three-stage revenue funnel: hours worked → hours billed (realization) → cash collected (collection rate)
- Utilization tracker by attorney seniority level — partner, senior associate, junior associate, paralegal
- Trust account (IOLTA) tracking in cash flow — client funds separated from firm operating cash
- WIP and disbursement receivable modeling for accurate cash flow timing
- 24-month P&L with gross and net margin benchmarks displayed alongside projections
How to Use This Law Firm Financial Model Spreadsheet
Start in the Assumptions sheet. Enter your attorney headcount by seniority — partners, senior associates, junior associates, and paralegals — along with their billing rates and target billable hours per year. If you're an existing firm, pull last year's time records to calculate actual billable hours per attorney and your historical realization rate (hours billed ÷ hours worked). Most firms find their actual realization rate is 5–15% below their target when they first measure it, which shows up as the gap between what attorneys think they're billing and what actually gets collected. Enter your billing structure mix: what percentage of your revenue comes from hourly matters, flat fees, retainers, and contingency? Then add your cost structure — attorney draws, staff salaries, malpractice premiums, research subscriptions, and overhead. The Utilization & Realization sheet will immediately show whether your revenue targets are achievable given your current headcount and rates.
Once assumptions are set, review the Revenue Model and P&L sheets. Check that your projected gross margin falls in the 40–60% range typical for law firms and that net margin is tracking toward 15–35%. If gross margin is low, the culprit is usually one of three things: billing rates below market, a realization rate being dragged down by write-offs on certain matters, or a practice area mix weighted too heavily toward low-rate work. The Cash Flow sheet is especially important if your firm carries significant WIP — work performed but not yet invoiced — because that's cash you've earned but don't have yet. Set your invoicing frequency in the assumptions (monthly, at milestones, or at matter close) and the model will show you the resulting cash timing. Trust account balances are tracked separately so you never accidentally count client funds as firm income.
15 minutes from download to your first law firm financial projection
Download the template, plug in your billing rates and headcount, and see your firm's full financial picture — revenue by billing type, utilization tracking, realization rates, and 24-month P&L included.
Why Every Law Firm Needs a Financial Model
Law firm economics run on three rates that every managing partner should know by heart: utilization rate, realization rate, and collection rate. Utilization measures how much of an attorney's available time is spent on billable work. Realization measures how much of that billable time actually makes it onto an invoice after write-offs and billing adjustments. Collection measures how much of what's billed is eventually paid. Multiply the three together and you get the effective revenue yield on attorney time — which for many firms is 20–30% lower than partners assume when they're doing mental math on headcount and rates. A financial model that explicitly tracks all three makes those gaps visible before they compound into a cash flow problem.
The billing structure mix shapes cash flow more than most law firm managers realize. Hourly matters generate WIP that builds over the life of a case before it's invoiced, creating a lag between work performed and cash collected that can stretch to 60–90 days or more on complex litigation. Flat-fee matters, when priced accurately, produce predictable margins and faster cash collection — but one under-scoped matter can eliminate the profitability on five properly scoped ones. Retainers provide the most stable monthly cash flow because clients pay upfront, making them the closest thing to recurring revenue a law firm can have. Contingency matters are cash-flow negative for their entire duration and only pay off at settlement or verdict. A financial model that separates each revenue stream lets you see whether your mix supports the firm's operating costs and growth plans, or whether you're carrying too much contingency risk relative to your cash reserves.
Law Firm Industry at a Glance
Financial templates built for law firms and legal practices — from solo practitioners to mid-size firms. Pre-loaded with billing rate structures, matter tracking, and trust account categories.
Revenue Drivers
- Billable hours (hourly engagements)
- Flat fee matters
- Retainer agreements
- Contingency fee recoveries
Key Cost Categories
- Attorney compensation & draws
- Paralegal & staff salaries
- Malpractice insurance
- Legal research subscriptions (Westlaw, LexisNexis)
- Office rent & overhead
- Bar dues, CLE & licensing
Typical Margins
Gross: 40-60% · Net: 15-35%
Seasonality
Q4 typically busiest for transactional and corporate practices (year-end deals); litigation practices are more event-driven. January is slower across most practice areas.
Key Performance Indicators
Law Firm Financial Model Template FAQ
More Law Firm Templates
Law Firm Balance Sheet Template for Excel
$29
Law Firm Budget Template for Excel
$29
Law Firm Business Plan Template for Excel
$39
Law Firm Cash Flow Template for Excel
$29
Law Firm Expense Tracker Template for Excel
$29
Law Firm Income Statement Template for Excel
$29
Law Firm Invoice Template for Excel
$29
Law Firm KPI Dashboard Template for Excel
$29
Law Firm P&L Template for Excel
$29
Law Firm Pro Forma Template for Excel
$29
Law Firm Project Budget Template for Excel
$29
Law Firm Sales Forecast Template for Excel
$29
Law Firm Valuation Template for Excel
$29
More Financial Model Templates
Law Firm Financial Model Template
$29