Photography KPI Dashboard Template
Monitor every number that matters for your photography business — bookings, revenue per client, print attach rate, and cost of doing business — in one pre-built Excel dashboard.
What's Inside This Photography KPI Dashboard Template
This template includes 5 worksheets, each designed for a specific part of your photography financial workflow:
KPI Dashboard
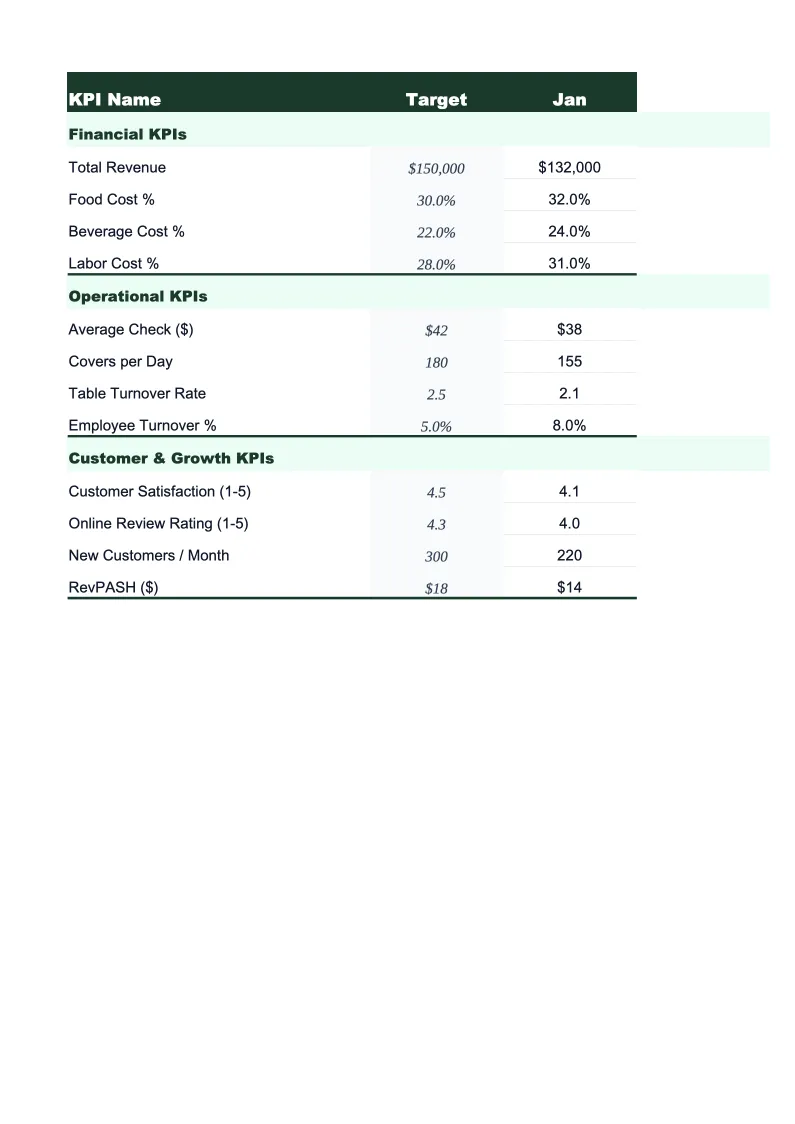
The main overview sheet displaying all key performance metrics for your photography business at a glance.
Monthly Input
The data entry sheet where you record your numbers each month.
Booking Funnel
Tracks your inquiry-to-booking pipeline across each month of the year.
Revenue by Category
Breaks your income into the revenue streams that matter most for photographers: portrait session fees, wedding and event coverage, commercial and licensing work, print and album sales, and digital download packages.
Goals & Benchmarks
Set your annual targets for the metrics that drive your photography business: total revenue goal, number of sessions, average revenue per client, print sales attach rate, and cost of doing business per shooting hour.
Photography KPI Dashboard Template Features
- Pre-loaded with photographer KPIs: ARPC, booking conversion rate, print attach rate, and CODB per hour
- Booking funnel tracker from first inquiry through delivered gallery
- Revenue breakdown by session type, print sales, licensing, and digital downloads
- Monthly trend charts for revenue, bookings, and gross margin
- Annual goals tracker with year-to-date progress and projected year-end totals
- Color-coded performance indicators — green when on target, red when behind
How to Use This Photography KPI Spreadsheet
Start by setting up the Goals & Benchmarks sheet with your annual targets — total revenue, number of sessions, average booking value, and your print attach rate goal. These numbers don't need to be precise on day one; you can update them after your first few months of data. Then move to the Monthly Input sheet and enter your numbers for the most recent completed month. You'll need your booking records (or CRM), your invoices or payment reports, and a basic expense summary. The whole entry process takes about 15 minutes.
Each month, return to the Monthly Input sheet and add a new month of data. The KPI Dashboard and Revenue by Category sheets update automatically, so your charts and status indicators always reflect your latest numbers. The Booking Funnel sheet is worth reviewing each month too — enter the raw inquiry and conversion counts from your inbox or CRM, and you'll quickly see whether your conversion rate is trending up or down. Most photographers find that booking conversion is the number they'd been ignoring that matters most.
15 minutes from download to your first photography dashboard
Download the template, enter last month's numbers, and see your booking conversion rate, revenue per client, and print attach rate in one view.
Why Every Photography Business Needs a KPI Dashboard
Most photographers track their income in a rough way — they know if this month was better or worse than last month — but they don't have visibility into the metrics that actually explain why. Average Revenue Per Client (ARPC) is the most important number for a photography business because it tells you whether you're growing through better clients or just more sessions. A photographer doing 80 sessions at $400 each works harder and earns less than one doing 50 sessions at $800 each. Without tracking ARPC month over month, it's easy to stay busy without getting ahead.
Print attach rate and cost of doing business per hour are the two metrics most photographers skip entirely. Print attach rate — the percentage of portrait clients who purchase prints or albums — is one of the highest-leverage numbers in the business because a single wall art sale can add $300–$1,500 to a booking with no additional shooting time. CODB per hour is what tells you whether your session fee is actually profitable: once you account for editing time, equipment depreciation, insurance, software subscriptions, and marketing, a $250 portrait session can easily net under $30 per hour of total time invested. Tracking both metrics makes the profitability math visible.
Photography Industry at a Glance
Financial templates built for photographers and photography studios — from solo portrait photographers to commercial studios. Pre-loaded with session fees, licensing line items, print product categories, and industry-standard KPIs.
Revenue Drivers
- Session bookings
- Print & product sales
- Image licensing fees
- Digital download packages
- Second shooter add-ons
Key Cost Categories
- Equipment purchase & depreciation
- Editing software subscriptions
- Gallery delivery platform fees
- Studio rent
- Lab & printing costs (COGS)
- Equipment & liability insurance
- Marketing & advertising
- Travel & location expenses
Typical Margins
Gross: 50-70% · Net: 15-35%
Seasonality
Peak seasons: spring (April–June) and fall (September–November) for portraits and weddings. December busy for holiday portraits. January–February typically slowest.
Key Performance Indicators
Photography KPI Dashboard Template FAQ
More Photography Templates
Photography Balance Sheet Template for Excel
$29
Photography Budget Template for Excel
$29
Photography Business Plan Template for Excel
$39
Photography Cash Flow Template for Excel
$29
Photography Expense Tracker Template for Excel
$29
Photography Financial Model Template for Excel
$29
Photography Income Statement Template for Excel
$29
Photography Invoice Template for Excel
$29
Photography P&L Template for Excel
$29
Photography Business Pro Forma Template for Excel
$29
Photography Project Budget Template for Excel
$29
Photography Sales Forecast Template for Excel
$29
Photography Business Valuation Template for Excel
$29
More KPI Dashboard Templates
Photography KPI Dashboard Template
$29