Auto Repair Pro Forma Template
Project three years of labor revenue, parts sales, and shop cash flow — built around bay count, daily car volume, average repair order, and the parts-to-labor economics that drive auto repair profitability.
What's Inside This Auto Repair Pro Forma Template
This template includes 6 worksheets, each designed for a specific part of your auto repair financial workflow:
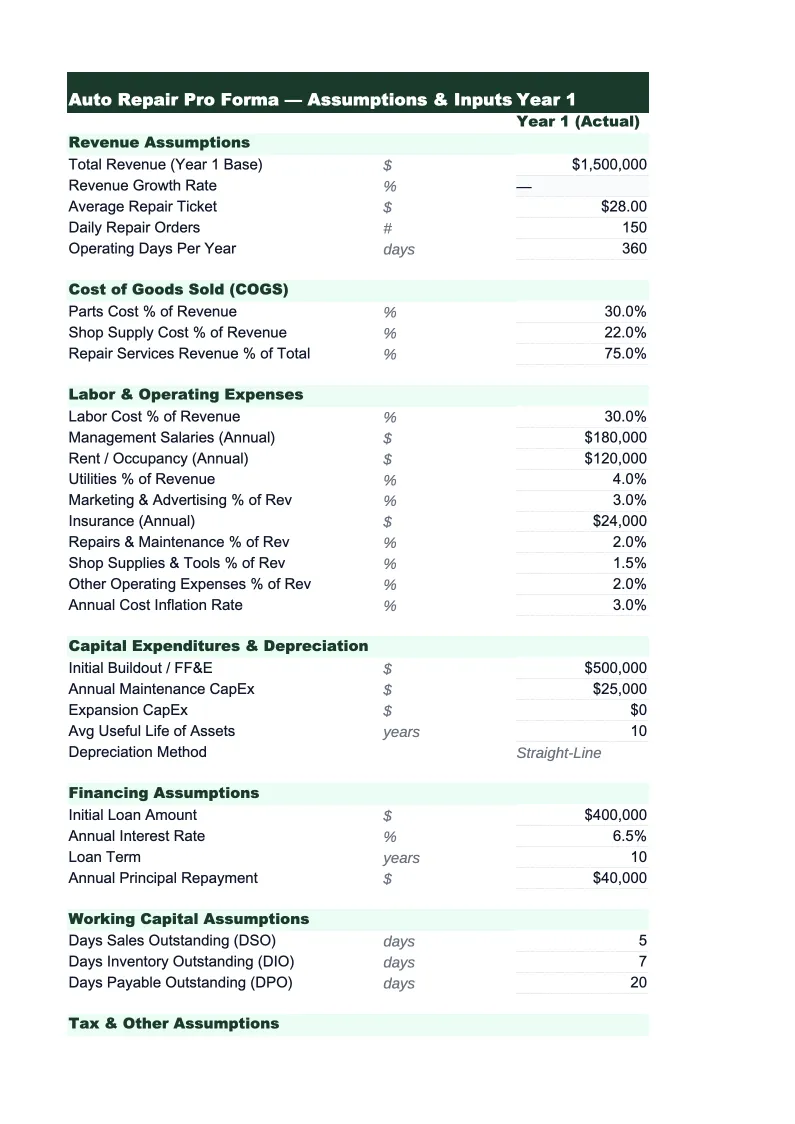
Assumptions
The central input sheet that drives every projection in the model.
Revenue Projections
Projects monthly revenue across all auto repair shop revenue streams over a 36-month horizon.
COGS & Labor
Projects the two largest cost categories in the auto repair business: parts cost of goods sold and technician labor.
Projected P&L
A complete three-year projected income statement organized in the standard auto repair format: gross revenue by stream (labor, parts, oil changes and maintenance, diagnostic fees, tire sales), total parts COGS, gross profit and gross margin percentage, direct technician labor, service advisor compensation, rent and occupancy (facility lease, utilities, property insurance), equipment and lift maintenance, shop supplies, liability and garage keepers insurance, marketing and advertising, software and technology (shop management system, parts lookup), and other general overhead.
Cash Flow Projection
Maps your projected cash position month by month, accounting for the timing between revenue collection and major outflows — payroll, parts vendor invoices (most shops run on net-30 accounts), equipment lease payments, and insurance premiums.
Dashboard
A one-page visual summary pulling the key auto repair metrics from the underlying sheets.
Auto Repair Pro Forma Template Features
- Bottom-up revenue model built from bay count, cars per day, ARO, and technician efficiency
- Labor and parts revenue modeled separately with independent margin calculations
- Startup costs section for shop acquisition, equipment purchase, and working capital
- 36-month projected P&L with monthly year-one detail and quarterly years two and three
- Cash flow projection with minimum balance alert and net-30 parts payables timing
- Lender-ready dashboard with effective labor rate, parts margin, and technician efficiency KPIs
How to Use This Auto Repair Shop Financial Projections Spreadsheet
Start on the Assumptions sheet and work through it from top to bottom. The most important inputs are the number of service bays, average cars per bay per day, and average repair order (ARO) size. If you have an existing shop, pull car count from your shop management system and ARO from your monthly sales report — most well-run independent shops run $350–$500 ARO. For a new location, use 4–5 cars per bay per day as a conservative starting point and adjust once you have real volume data. Set your posted labor rate, your technician efficiency percentage, and your parts-to-labor ratio. These five numbers drive the majority of the model, so spending 20 minutes getting them right is worth it.
Once the Assumptions sheet is set, review the Revenue Projections and COGS & Labor sheets to check that the outputs look realistic. Confirm that your parts gross margin is landing in the 45–55% range — if it's lower, you may be pricing parts too close to cost or your supplier pricing is softer than average. Check that your effective labor rate (actual revenue divided by total technician hours) is close to your posted rate — a big gap means low technician efficiency or excessive comebacks. If you're projecting a new shop or acquisition, fill in the startup costs section of the Cash Flow sheet: deposit, equipment, initial parts inventory (typically 2–3 weeks of parts COGS), and working capital reserve of at least 3 months of operating expenses.
15 minutes from download to your first shop projection
Download the template, enter your bay count, ARO, and labor rate, and get a complete 3-year financial projection for your auto repair shop.
Why Auto Repair Shops Need a Pro Forma Template
Auto repair shops look straightforward on the surface — charge labor, sell parts, collect cash — but the economics are more nuanced than most small businesses. The profitability of a shop comes down to three variables working together: car count, average repair order size, and technician efficiency. A shop with 4 bays running at 4 cars per bay per day at a $400 ARO generates roughly $230,000 per month in gross revenue. But if technician efficiency drops from 90% to 70% — common in understaffed shops or during technician turnover — you lose 20% of your billable hours without reducing your labor cost, and the impact on net margin is immediate. A pro forma forces you to model these dynamics explicitly before you sign a lease or make a hire.
The parts-to-labor ratio is the other lever most shop operators underappreciate. For general repair shops, a healthy parts-to-labor ratio runs 0.9:1 to 1.2:1 — meaning for every dollar of labor revenue, you're generating $0.90–$1.20 in parts revenue. Parts margins are typically higher than labor margins on a gross basis because the parts markup (cost to retail) runs 50–100% depending on your supplier relationships and whether you're using OEM or aftermarket. Shops that let service advisors discount parts heavily to win jobs are often giving away their most profitable revenue stream without realizing it. The template tracks parts margin percentage separately so you can see exactly what your effective markup is and how it compares to industry benchmarks.
Auto Repair Industry at a Glance
Financial templates built for auto repair shops — from single-bay independents to multi-location service centers. Pre-loaded with labor, parts, and overhead categories specific to the automotive service industry.
Revenue Drivers
- Labor (repair services)
- Parts sales
- Oil changes & maintenance
- Diagnostics & inspections
- Tire sales
- Shop supplies fees
Key Cost Categories
- Parts & materials (COGS)
- Technician labor
- Rent & occupancy
- Equipment & tools
- Utilities
- Insurance
- Marketing & advertising
- Shop supplies
Typical Margins
Gross: 50-60% · Net: 5-15%
Seasonality
Busiest in summer (June–August) and spring (March–May) for maintenance and travel prep; January–February are consistently the slowest months.
Key Performance Indicators
Auto Repair Pro Forma Template FAQ
More Auto Repair Templates
Auto Repair Shop Balance Sheet Template for Excel
$29
Auto Repair Shop Budget Template for Excel
$29
Auto Repair Shop Business Plan Template for Excel
$39
Auto Repair Shop Cash Flow Template for Excel
$29
Auto Repair Expense Tracker Template for Excel
$29
Auto Repair Financial Model Template for Excel
$29
Auto Repair Income Statement Template for Excel
$29
Auto Repair Invoice Template for Excel
$29
Auto Repair KPI Dashboard Template for Excel
$29
Auto Repair P&L Template for Excel
$29
Auto Repair Shop Project Budget Template for Excel
$29
Auto Repair Sales Forecast Template for Excel
$29
Auto Repair Shop Valuation Template for Excel
$29
Auto Repair Pro Forma Template
$29