Personal Training KPI Dashboard Template
Track the numbers that drive a personal training business — client retention, session utilization, revenue per hour, package renewals, and active client count — in one pre-built Excel dashboard.
What's Inside This Personal Training KPI Dashboard Template
This template includes 5 worksheets, each designed for a specific part of your personal training financial workflow:
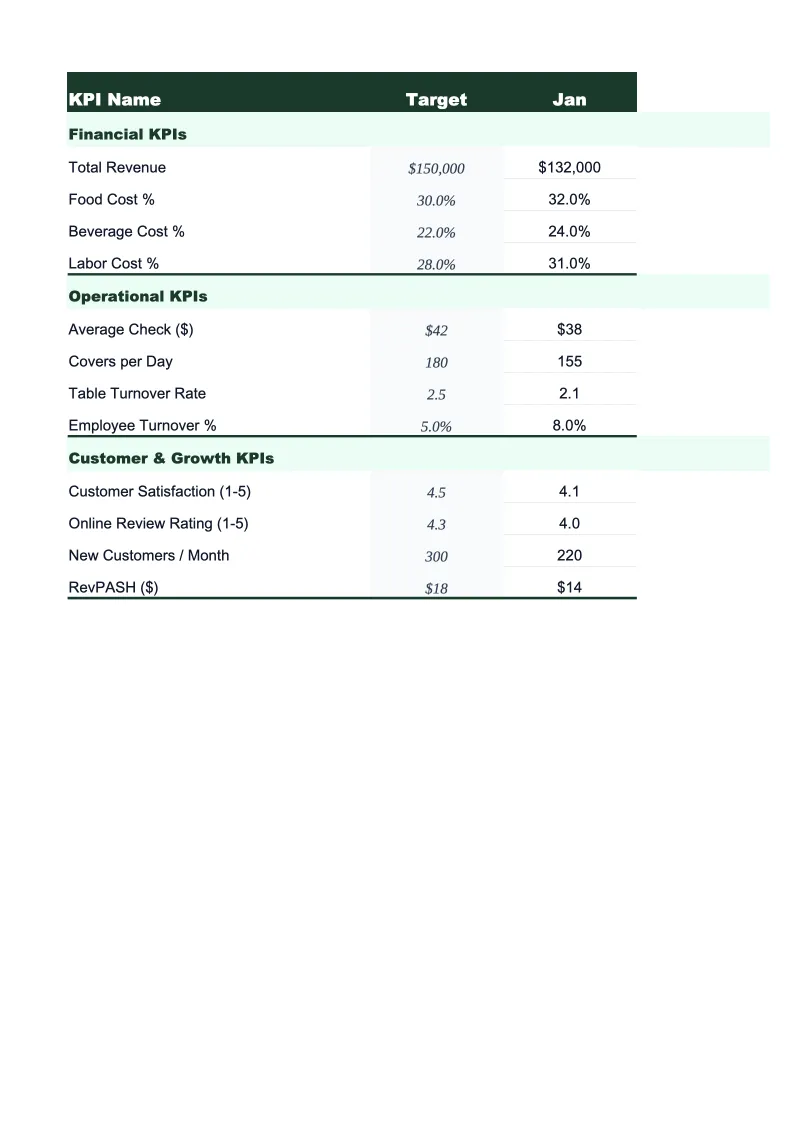
KPI Dashboard
The main overview sheet displaying every critical personal training metric in one place.
Monthly Input
The data entry sheet where you record your business numbers each month.
Client Tracker
Tracks each active client's status, package type, sessions remaining, start date, and renewal date across the year.
Revenue by Service Type
Breaks your income into the revenue streams that drive a personal training business: one-on-one sessions, training packages, group classes, online coaching, and add-on services like nutrition coaching.
Goals & Benchmarks
Set your annual targets for the metrics that matter most: total revenue, active client count, session utilization rate, client retention rate, and revenue per hour.
Personal Training KPI Dashboard Template Features
- Pre-loaded with personal training KPIs: session utilization rate, client retention rate, revenue per hour, and package renewal rate
- Client-level tracker with package type, sessions remaining, and renewal date for every active client
- Revenue breakdown by service type — one-on-one, packages, group classes, online coaching, and add-ons
- Monthly trend charts for revenue, active clients, and session utilization
- Annual goals tracker with year-to-date progress and projected year-end totals
- Color-coded performance indicators — green when on target, red when behind
How to Use This Personal Training KPI Spreadsheet
Start by setting up the Goals & Benchmarks sheet with your annual targets — total revenue, target active client count, session utilization goal, and client retention rate. These don't need to be precise on day one; even rough targets give you something to measure against. Then move to the Client Tracker and enter each of your current clients: their name, package type, sessions remaining, and renewal date. This setup takes about 20–30 minutes depending on how many clients you have, and it's the foundation everything else builds on.
Each month, return to the Monthly Input sheet and enter your numbers for the previous month. You'll need your scheduling records, payment history, and an expense summary. The KPI Dashboard, Revenue by Service Type, and Goals & Benchmarks sheets update automatically. Update the Client Tracker whenever a client renews, starts, or drops — keeping it current is what makes the renewal date alerts useful. Most trainers find the Client Tracker is worth reviewing weekly during the first few years to stay on top of who's approaching the end of a package.
15 minutes from download to your first training dashboard
Download the template, enter your clients and last month's sessions, and see your utilization rate, retention rate, and revenue per hour in one view.
Why Every Personal Trainer Needs a KPI Dashboard
Personal trainers often build a full book of clients within the first two years and then wonder why revenue has plateaued. The reason is almost always client retention. Acquiring a new client takes marketing time, trial sessions, and sales effort. Retaining an existing client takes a renewal conversation and consistent results. Yet most trainers track their monthly revenue without ever calculating what percentage of their clients are still training with them 90 days after they start. A 60% retention rate means four out of ten clients you bring on in January have quietly stopped by April. That's a constant uphill walk.
Session utilization and revenue per hour are the two metrics that reveal whether your schedule is working. Session utilization rate — sessions completed divided by total available session slots — shows how full your calendar actually is versus how full it feels. Revenue per hour accounts for the full time each client requires: session time, programming, check-ins, and admin. A trainer charging $80/session but spending 20 minutes per client per week on extras outside the session is earning roughly $60/hour for that relationship. Tracking both metrics monthly shows where your pricing and scheduling structure are costing you.
Personal Training Industry at a Glance
Financial templates built for personal trainers and fitness coaches — from solo trainers billing individual clients to studio owners managing packages, group classes, and recurring memberships.
Revenue Drivers
- One-on-one sessions
- Training packages
- Group classes
- Online coaching
- Nutrition coaching add-ons
Key Cost Categories
- Gym rental or facility fees
- Equipment and supplies
- Liability insurance
- Certification and continuing education
- Software and scheduling tools
- Marketing and referral costs
Typical Margins
Gross: 70-85% · Net: 30-55%
Seasonality
January and September are peak sign-up months; summer and the holiday stretch see higher drop-off. Renewal cycles are often tied to 4-, 8-, or 12-week package structures.
Key Performance Indicators
Personal Training KPI Dashboard Template FAQ
More Personal Training Templates
Personal Training Balance Sheet Template for Excel
$29
Personal Training Budget Template for Excel
$29
Personal Training Business Plan Template for Excel
$39
Personal Training Cash Flow Template for Excel
$29
Personal Training Expense Tracker Template for Excel
$29
Personal Training Financial Model Template for Excel
$29
Personal Training Income Statement Template for Excel
$29
Personal Training Invoice Template for Excel
$29
Personal Training P&L Template for Excel
$29
Personal Training Pro Forma Template for Excel
$29
Personal Training Project Budget Template for Excel
$29
Personal Training Sales Forecast Template for Excel
$29
Personal Training Business Valuation Template for Excel
$29
More KPI Dashboard Templates
Personal Training KPI Dashboard Template
$29