Personal Training Sales Forecast Template
Forecast revenue across one-on-one sessions, packages, group classes, and online coaching — with assumptions you can actually adjust for January peaks and summer drop-off.
What's Inside This Personal Training Sales Forecast Template
This template includes 6 worksheets, each designed for a specific part of your personal training financial workflow:
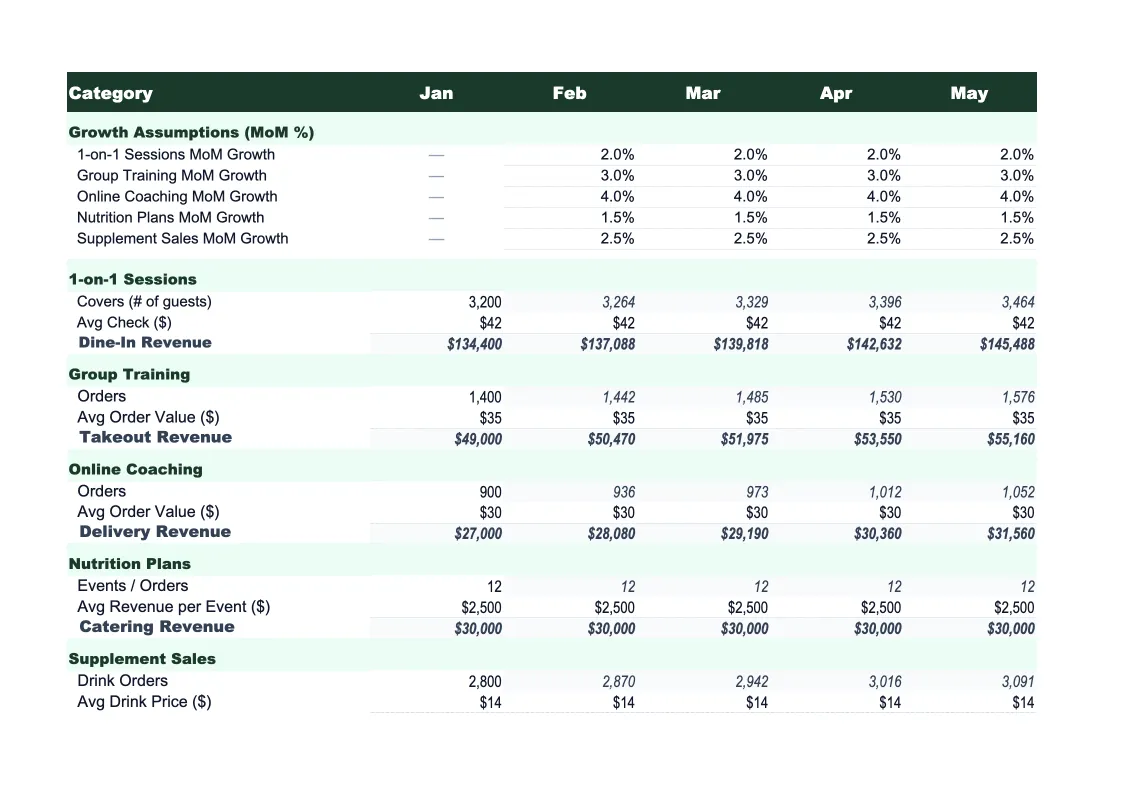
Assumptions
The starting point for your entire forecast.
Monthly Revenue Forecast
A 12-month breakdown of projected revenue by service line: one-on-one sessions, training packages, group classes, online coaching, and add-on services like nutrition coaching or programming.
Client Pipeline
Tracks the flow of clients through your business month by month: starting active clients, projected new client sign-ups, expected churn or drop-off, and ending active client count.
Actual vs Forecast
Enter your real monthly revenue and client numbers as the year progresses, and this sheet calculates the dollar variance and percentage variance against your forecast for every service line.
Scenario Planner
Models three versions of your business side by side: a base case using your Assumptions inputs, an upside scenario (more new clients, higher retention, or a rate increase), and a downside scenario (slower growth, higher churn, or a pricing rollback).
Dashboard
A one-page visual summary with charts for monthly revenue by service line, client count trends over the forecast period, and a cumulative revenue-to-date chart that shows how fast you're pacing toward your annual target.
Personal Training Sales Forecast Template Features
- Revenue projections by session type, package, and online coaching
- Client pipeline tracker with new client acquisition and churn modeling
- Seasonality adjustments for January peaks and summer drop-off
- Actual vs forecast variance tracking with color-coded alerts
- Three-scenario planner (base, upside, downside)
- Pre-built dashboard with client count and revenue trend charts
How to Use This Personal Training Sales Forecast Spreadsheet
Start with the Assumptions sheet — it takes about 15 minutes to set up. Enter your current active client count, your rates for each service type (one-on-one sessions, packages, group classes, online coaching), and your best estimate of how many new clients you expect each month and how many you typically lose. If you're not sure about churn, look at the last three months and count how many clients dropped off — that's your baseline. Adjust the seasonality row to reflect your January surge and summer slowdown if those patterns apply to your business.
Once the assumptions are in, the Monthly Revenue Forecast and Client Pipeline sheets are already calculated. Review the 12-month totals and ask whether the numbers look realistic — if your forecast assumes 40 active clients but you've never had more than 25, adjust your acquisition rate down. The Scenario Planner is useful here: model your conservative case first, then see what the upside looks like if retention improves or you add a group class revenue stream. This is also the right moment to decide whether your current pricing supports your income goals.
15 minutes from download to your first revenue forecast
Download the template, enter your client count and rates, and see a full 12-month projection with client pipeline, scenario planning, and variance tracking built in.
Why Personal Trainers Need a Sales Forecast
Personal training businesses look simple from the outside — you have clients, you charge per session, money comes in. But the revenue picture is more complicated once you're mixing one-on-one sessions at different rates, multi-session packages that pay upfront but get delivered over weeks, group classes with variable attendance, and online coaching with its own pricing structure. Without a forecast, it's easy to hit a great month in January and assume you're on track — then realize in March that you lost four clients and your recurring revenue dropped 20% without any visible warning.
The core mechanics of a personal training forecast are client count, average revenue per client, and retention. A trainer with 30 clients at $250/month per client runs a $90,000 annual business — but only if retention holds. If 20% of clients churn each quarter and aren't replaced, that same trainer ends the year at $60,000. Forecasting forces you to model these dynamics explicitly rather than assume your client base is stable when it isn't. January sign-ups are real revenue, but they're not reliable — the drop-off through spring is predictable enough to plan around if you've tracked it.
Personal Training Industry at a Glance
Financial templates built for personal trainers and fitness coaches — from solo trainers billing individual clients to studio owners managing packages, group classes, and recurring memberships.
Revenue Drivers
- One-on-one sessions
- Training packages
- Group classes
- Online coaching
- Nutrition coaching add-ons
Key Cost Categories
- Gym rental or facility fees
- Equipment and supplies
- Liability insurance
- Certification and continuing education
- Software and scheduling tools
- Marketing and referral costs
Typical Margins
Gross: 70-85% · Net: 30-55%
Seasonality
January and September are peak sign-up months; summer and the holiday stretch see higher drop-off. Renewal cycles are often tied to 4-, 8-, or 12-week package structures.
Key Performance Indicators
Personal Training Sales Forecast Template FAQ
More Personal Training Templates
Personal Training Balance Sheet Template for Excel
$29
Personal Training Budget Template for Excel
$29
Personal Training Business Plan Template for Excel
$39
Personal Training Cash Flow Template for Excel
$29
Personal Training Expense Tracker Template for Excel
$29
Personal Training Financial Model Template for Excel
$29
Personal Training Income Statement Template for Excel
$29
Personal Training Invoice Template for Excel
$29
Personal Training KPI Dashboard Template for Excel
$29
Personal Training P&L Template for Excel
$29
Personal Training Pro Forma Template for Excel
$29
Personal Training Project Budget Template for Excel
$29
Personal Training Business Valuation Template for Excel
$29
More Sales Forecast Templates
Personal Training Sales Forecast Template
$29