Veterinary KPI Dashboard Template
Track average client transaction, revenue per DVM hour, pharmacy COGS, new client growth, and the other metrics that separate a profitable veterinary practice from one that's just busy.
What's Inside This Veterinary Practice KPI Dashboard Template
This template includes 5 worksheets, each designed for a specific part of your veterinary financial workflow:
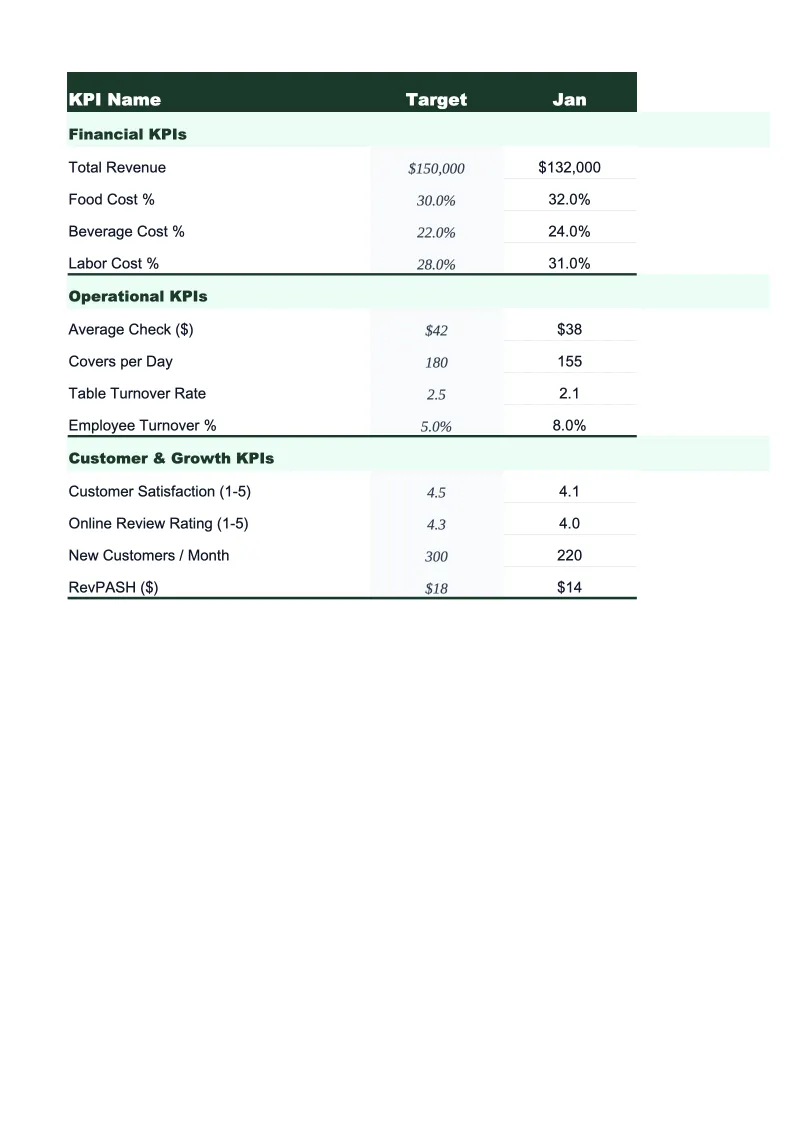
KPI Dashboard
The main visual overview of your practice's performance, designed to give you the full financial and operational picture in under two minutes.
Revenue & Production
The financial core of the dashboard, where you track revenue broken out by service category each month.
Patient & Visit Metrics
A structured worksheet for the volume and client relationship KPIs that determine whether your practice is growing and retaining patients.
Doctor & Staff Performance
A provider-level breakdown of production and efficiency for practices with more than one DVM on staff.
12-Month Trends
A rolling 12-month view of your most critical veterinary KPIs plotted as line and bar charts.
Veterinary Practice KPI Dashboard Features
- 20+ pre-loaded veterinary KPIs including ACT, revenue per DVM hour, and pharmacy COGS percentage
- Revenue breakdown by service category: wellness, surgery, pharmacy, diagnostics, dental, and emergency
- Client compliance tracker for heartworm, vaccines, and preventive care protocols
- Provider productivity comparison with revenue per DVM hour and average transaction per doctor
- Color-coded status indicators benchmarked to AVMA and veterinary practice management standards
- 12-month trend charts for revenue, COGS, new clients, and visit volume
How to Use This Veterinary Practice KPI Spreadsheet
Start by setting your targets on the KPI Dashboard tab. The template ships with benchmark ranges pre-populated — COGS at 20–26% of revenue, staff payroll at 40–45%, ACT appropriate for a general small animal practice, new client targets based on your practice size and market. Review each target and adjust for your practice type: an emergency and critical care clinic will have very different COGS, staffing, and revenue-per-visit benchmarks than a general wellness practice, and a multi-DVM hospital operates at a different scale than a solo practitioner. This calibration takes about 20–30 minutes and only needs to happen once unless your practice structure changes significantly.
Each month, enter your data across four sheets. Revenue & Production gets your monthly revenue by service category — most practice management software (AVImark, Cornerstone, ezyVet, Impromed) can export a month-end production summary in under 10 minutes. Patient & Visit Metrics gets your total visits, new client count, and compliance rates. Doctor & Staff Performance gets hours worked and gross revenue per provider. Once those three sheets are current, the KPI Dashboard and 12-Month Trends sheets update automatically with no additional work required on those tabs.
15 minutes from download to your first KPI review
Download the template, enter your targets, and start tracking the average client transaction, COGS percentage, and new client metrics that actually determine whether your veterinary practice is growing.
Why Every Veterinary Practice Needs a KPI Dashboard
Veterinary practices have a financial structure that's more complex than it looks from the outside. Revenue comes from multiple service lines — exams, surgery, pharmacy, diagnostics, dental, boarding — each with different margins, different cost structures, and different staffing requirements. A practice that's generating strong top-line revenue can still be financially stressed if pharmacy COGS is running at 30% instead of 22%, if staff payroll has grown faster than patient volume, or if average client transaction hasn't increased to keep pace with rising drug and supply costs. These problems don't show up in your appointment schedule or in your bank account until they've been accumulating for months; they only become visible when you track the right metrics against meaningful targets.
The metrics that determine veterinary practice financial health cluster around three areas. Revenue efficiency: average client transaction (the industry average for a general small animal practice runs $150–$300 depending on market; specialty and emergency practices run higher), revenue per DVM hour (typically $200–$350 for a general practitioner), and revenue by service category to identify which lines are growing and which are declining. Cost control: COGS as a percentage of revenue (drugs and supplies combined should run 20–26%; pharmacy-heavy practices can run higher but need to monitor it actively), and staff payroll as a percentage of revenue (40–45% is the standard benchmark; above 50% usually signals a capacity mismatch). Growth and retention: new clients per month, active client count, and compliance rates for preventive care protocols, since compliance is both a patient health outcome and one of the most reliable revenue drivers in general practice.
Veterinary Industry at a Glance
Financial templates built for veterinary practices — from small animal clinics to multi-location hospitals. Pre-loaded with exam, surgery, pharmacy, and diagnostic categories.
Revenue Drivers
- Wellness exams and preventive care
- Surgical procedures
- Pharmacy and medication sales
- Diagnostics and lab work
- Dental procedures
- Emergency and urgent care
Key Cost Categories
- Medications and pharmaceuticals (COGS)
- Medical and surgical supplies
- Veterinarian salaries
- Technician and support staff wages
- Facility rent and utilities
- Diagnostic equipment and lab fees
Typical Margins
Gross: 74-78% · Net: 10-15%
Seasonality
Spring and fall peaks for wellness visits and heartworm testing; summer uptick in emergency visits; relatively stable year-round compared to many industries.
Key Performance Indicators
Veterinary Practice KPI Dashboard Template FAQ
More Veterinary Templates
Veterinary Practice Balance Sheet Template for Excel
$29
Veterinary Budget Template for Excel
$29
Veterinary Business Plan Template for Excel
$39
Veterinary Practice Cash Flow Template for Excel
$29
Veterinary Expense Tracker Template for Excel
$29
Veterinary Practice Financial Model Template for Excel
$29
Veterinary Income Statement Template for Excel
$29
Veterinary Invoice Template for Excel
$29
Veterinary Practice P&L Template for Excel
$29
Veterinary Pro Forma Template for Excel
$29
Veterinary Project Budget Template for Excel
$29
Veterinary Sales Forecast Template for Excel
$29
Veterinary Practice Valuation Template for Excel
$29
More KPI Dashboard Templates
Veterinary KPI Dashboard Template
$29