Wedding Planning KPI Dashboard Template
Track the metrics that drive a profitable wedding planning business — revenue per event, booking conversion rate, outstanding payment milestones, gross margin by package, and referral percentage — in one dashboard built for planners and coordinators.
What's Inside This Wedding Planner KPI Dashboard Template
This template includes 6 worksheets, each designed for a specific part of your wedding planning financial workflow:
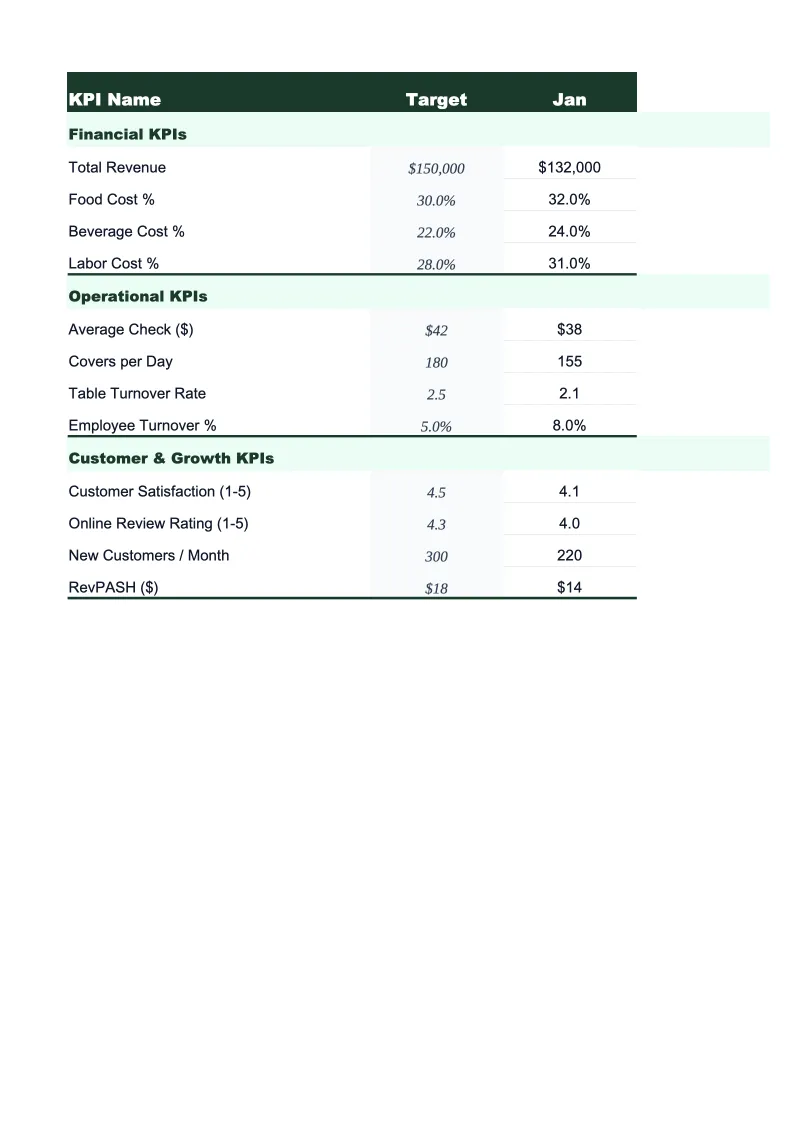
KPI Overview
The main dashboard that surfaces your wedding planning business's most critical performance indicators on a single screen.
Bookings & Revenue
Tracks every active wedding contract with the key financial details: client name, event date, total contract value, package type (full-service, partial planning, day-of coordination), payment milestone schedule, and amounts collected to date.
Booking Funnel
Monitors your inquiry-to-contract conversion rate by lead source — The Knot, WeddingWire, Instagram, Google, and client referrals.
Profitability per Event
Calculates your true gross margin on each wedding by tracking contract revenue against direct costs — assistant coordinator wages, sub-planner fees, vendor pass-through costs, mileage, and planning software charges for the event.
Accounts Receivable
Tracks every outstanding payment milestone across all active contracts with due dates, amounts, and days outstanding.
Monthly Trends
A 12-month rolling view of your five core KPIs displayed as line charts — average revenue per wedding, gross margin percentage, inquiry volume, booking conversion rate, and accounts receivable percentage — so you can see how performance has moved across the year.
Wedding Planner KPI Dashboard Template Features
- Revenue per wedding and gross margin per event with direct cost tracking and effective hourly rate calculation
- Booking funnel tracking by lead source — referrals vs. The Knot, WeddingWire, Instagram, and Google
- Outstanding AR tracker with overdue milestone alerts and AR-to-booked-revenue ratio
- Profitability per event with hours worked, effective rate, and package-type comparison
- Referral rate tracking to measure word-of-mouth performance over time
- 12-month trend charts showing seasonality in bookings, events, and revenue
How to Use This Wedding Planning KPI Spreadsheet
Getting started takes about 20 minutes. Download the .xlsx file and open it in Excel or Google Sheets. Begin with the Bookings & Revenue sheet: enter each of your active contracts with the event date, package type, total contract value, and payment milestones. Then open the Accounts Receivable sheet and log which milestones have been collected and which are outstanding. Once those two sheets are populated, the KPI Overview dashboard will display your current average contract value, gross margin, and AR position automatically — giving you a useful baseline before you've touched anything else.
For ongoing use, update the dashboard in two rhythms. First, update the Accounts Receivable sheet every week or two as milestone payments come in — this is your most time-sensitive tracker and keeps you from losing track of what's overdue. Second, update the Booking Funnel sheet whenever you receive a new inquiry or sign a new contract, logging the source and outcome. Monthly, enter your profitability data for any events that completed during the period: total hours worked, direct costs incurred, and any add-on revenue. The Profitability per Event sheet is most useful when updated within a week of each event while your recollection of the work involved is fresh.
20 minutes from download to your first business review
Download the template, enter your active contracts and inquiries, and see your wedding planning business's real margins, conversion rates, and AR position in one dashboard.
Why Every Wedding Planner Needs a KPI Dashboard
Wedding planning is a service business where the financials are structurally deceptive. Revenue looks strong when you have a full calendar, but the number that actually determines profitability is gross margin per event — contract value minus direct costs — and most planners don't calculate it rigorously until they realize they've had a six-figure year and very little to show for it. The industry's typical gross margins of 55–70% are achievable, but they require tracking what you actually spend on each event: assistant wages, sub-planner fees, vendor pass-throughs, and the hours you personally put in. Without a dashboard, the instinct is to focus on bookings, not on which bookings actually make money.
The KPIs that distinguish thriving wedding planning businesses from chronically overworked ones fall into three categories. Revenue quality — average contract value, gross margin per event, and effective hourly rate — tells you whether your pricing and scope are aligned with the work involved. Pipeline health — inquiry volume, booking conversion rate by source, and referral percentage — tells you whether your business development is working and which channels deserve more investment. Financial stability — accounts receivable as a percentage of booked revenue and milestone collection timeliness — tells you whether your cash position is as strong as your calendar looks. Referral rate deserves particular attention: planners who generate 50–70% of new bookings from past client referrals and vendor relationships operate with dramatically lower marketing costs and higher conversion rates than those dependent on directory listings.
Wedding Planning Industry at a Glance
Financial templates built for wedding planners and coordinators — from day-of coordinators to full-service agencies. Pre-loaded with fee structures, payment milestone tracking, and vendor pass-through categories.
Revenue Drivers
- Full-service planning fees
- Day-of coordination packages
- Vendor referral commissions
- Vendor pass-through markups
- Add-on services (rehearsal dinner, elopements)
Key Cost Categories
- Assistant coordinator wages
- Contractor/sub-planner fees
- Vendor pass-through costs
- Marketing (Knot/WeddingWire listings)
- Planning software subscriptions
- Professional liability insurance
- Transportation and mileage
Typical Margins
Gross: 55-70% · Net: 15-25%
Seasonality
Peak weddings in May-June (spring) and September-October (fall). January-February slowest for events but highest for new bookings from holiday-engaged couples.
Key Performance Indicators
Wedding Planner KPI Dashboard Template FAQ
More Wedding Planning Templates
Wedding Planning Balance Sheet Template for Excel
$29
Wedding Planning Budget Template for Excel
$29
Wedding Planning Business Plan Template for Excel
$39
Wedding Planning Cash Flow Template for Excel
$29
Wedding Planning Expense Tracker Template for Excel
$29
Wedding Planning Financial Model Template for Excel
$29
Wedding Planning Income Statement Template for Excel
$29
Wedding Planning Invoice Template for Excel
$29
Wedding Planner P&L Template for Excel
$29
Wedding Planning Pro Forma Template for Excel
$29
Wedding Planning Project Budget Template for Excel
$29
Wedding Planning Sales Forecast Template for Excel
$29
Wedding Planning Business Valuation Template for Excel
$29
More KPI Dashboard Templates
Wedding Planning KPI Dashboard Template
$29