Wedding Planning Sales Forecast Template
Project your wedding planning business revenue by service package and event date — with booking pipeline tracking, payment milestone modeling, and seasonal adjustment built in.
What's Inside This Wedding Planning Sales Forecast Template
This template includes 7 worksheets, each designed for a specific part of your wedding planning financial workflow:
Assumptions
The driver sheet for your entire forecast.
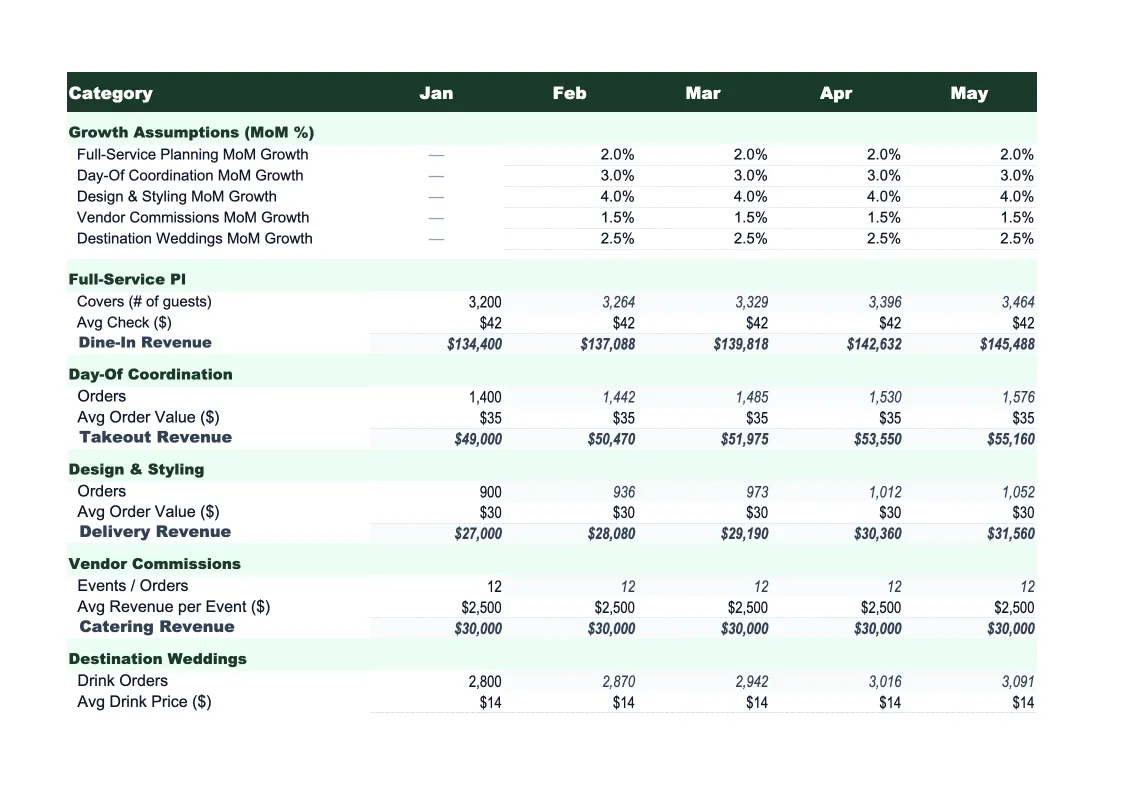
Monthly Forecast
The core projection sheet showing 12 months of projected revenue broken out by income stream: full-service planning fees, partial planning fees, month-of coordination fees, add-on services, and vendor referral commissions or pass-through markups.
Annual Summary
A full-year rollup pulling all 12 months into a single view: total projected revenue by income stream, projected number of events, average revenue per event, and year-over-year comparison rows if you're forecasting into a second year.
Booking Pipeline
A booked-event tracker that bridges your sales pipeline and your revenue forecast.
Actual vs Forecast
Enter your actual revenue collected each month — fees received, commissions earned, add-on charges billed — alongside your projections, and the sheet calculates dollar and percentage variance for every income stream.
Scenario Comparison
Three side-by-side forecast scenarios — base, upside, and downside — built from different inquiry volume, conversion rate, and average package fee assumptions.
Dashboard
A visual summary of your forecast with pre-built charts: monthly revenue by income stream (stacked bar), actual vs forecast trend line, revenue mix by service package (pie), and projected bookings by month over the forecast period.
Wedding Planning Sales Forecast Template Features
- Driver-based model: inquiries × conversion rate × package fee by service tier
- Revenue split across full-service, partial planning, month-of coordination, and add-ons
- Booking pipeline tracker with payment milestone scheduling
- Seasonal adjustment factors for spring and fall wedding cycles
- Three-scenario comparison (base, upside, downside)
- Actual vs forecast tracker with rolling accuracy score
How to Use This Wedding Planning Sales Forecast Spreadsheet
Start with the Assumptions sheet. List every service package you offer — full-service planning, partial planning, month-of coordination, elopement packages, add-on services — and enter the average fee you charge for each along with your estimated booking volume per month. If you're not sure on booking volume, divide last year's total events by 12 to get a baseline and then apply seasonal adjustments. Most wedding planners spend 20–30 minutes on the initial setup and find that working from their prior year's inquiry log makes the conversion rate estimates much more reliable.
With your assumptions in place, review the Monthly Forecast sheet to confirm the projections match the seasonal shape you'd expect: a surge in spring (April–June) and fall (September–October) for event activity, and a spike in January and February for new bookings from couples who got engaged over the holidays. Apply seasonal multipliers to the Assumptions sheet to reflect these patterns. Then set up the Scenario Comparison sheet — enter a conservative downside reflecting slower inquiry growth and a higher cancellation rate, and an optimistic upside reflecting a price increase or stronger conversion from a new marketing channel.
15 minutes from download to your first revenue forecast
Download the template, plug in your packages and booking pipeline, and see your wedding planning business's projected revenue — month by month, service tier by service tier.
Why Every Wedding Planner Needs a Sales Forecast
Wedding planners face a forecasting challenge that most service businesses don't: the date you book a client and the date you collect the final payment can be 12–18 months apart, and the event itself falls in a narrow seasonal window. A planner with a full calendar of fall weddings might look extremely busy in July through October while January through March is nearly empty. Without a forecast that separates booking activity from event activity from cash receipt timing, it's easy to mistake a full inbox for a financially healthy business — and to discover too late that the slow months are genuinely slow on revenue, not just on events.
For wedding planners, the two forecast variables that matter most are inquiry-to-booking conversion rate and the mix of service tiers being booked. Conversion rate is the biggest lever: most planners close 20–35% of serious inquiries, but small improvements — a faster response time, a stronger consultation process, better-priced packages — can move that rate meaningfully and compound across a full year of inquiries. Service mix matters because full-service planning fees typically run $4,000–$10,000+, partial planning runs $2,500–$5,000, and month-of coordination runs $1,200–$2,500 — a calendar filled with coordination-only clients produces very different revenue than the same number of full-service bookings.
Wedding Planning Industry at a Glance
Financial templates built for wedding planners and coordinators — from day-of coordinators to full-service agencies. Pre-loaded with fee structures, payment milestone tracking, and vendor pass-through categories.
Revenue Drivers
- Full-service planning fees
- Day-of coordination packages
- Vendor referral commissions
- Vendor pass-through markups
- Add-on services (rehearsal dinner, elopements)
Key Cost Categories
- Assistant coordinator wages
- Contractor/sub-planner fees
- Vendor pass-through costs
- Marketing (Knot/WeddingWire listings)
- Planning software subscriptions
- Professional liability insurance
- Transportation and mileage
Typical Margins
Gross: 55-70% · Net: 15-25%
Seasonality
Peak weddings in May-June (spring) and September-October (fall). January-February slowest for events but highest for new bookings from holiday-engaged couples.
Key Performance Indicators
Wedding Planning Sales Forecast Template FAQ
More Wedding Planning Templates
Wedding Planning Balance Sheet Template for Excel
$29
Wedding Planning Budget Template for Excel
$29
Wedding Planning Business Plan Template for Excel
$39
Wedding Planning Cash Flow Template for Excel
$29
Wedding Planning Expense Tracker Template for Excel
$29
Wedding Planning Financial Model Template for Excel
$29
Wedding Planning Income Statement Template for Excel
$29
Wedding Planning Invoice Template for Excel
$29
Wedding Planner KPI Dashboard Template for Excel
$29
Wedding Planner P&L Template for Excel
$29
Wedding Planning Pro Forma Template for Excel
$29
Wedding Planning Project Budget Template for Excel
$29
Wedding Planning Business Valuation Template for Excel
$29
More Sales Forecast Templates
Wedding Planning Sales Forecast Template
$29