Construction Pro Forma Template
Project a construction company's revenue, job costs, overhead, and net income across 5 years — with pre-built formulas for backlog, bid-to-win ratio, gross margin by project type, and break-even analysis.
What's Inside This Construction Pro Forma Template
This template includes 7 worksheets, each designed for a specific part of your construction financial workflow:
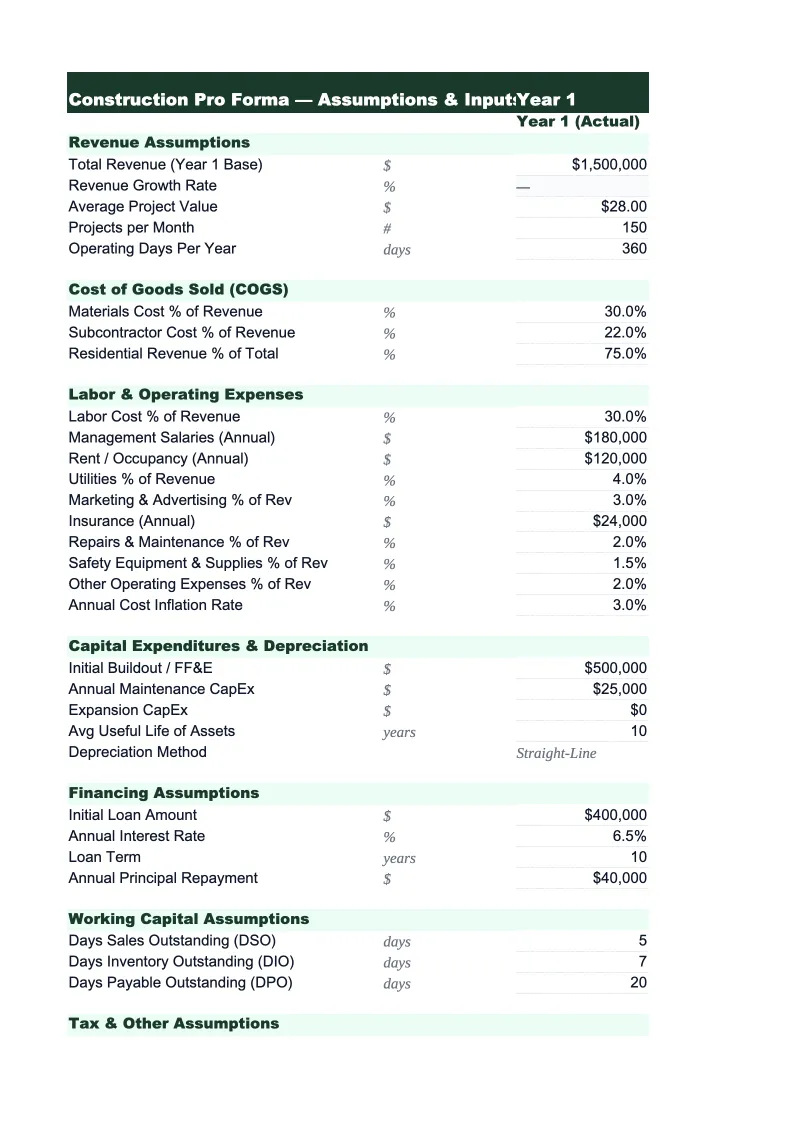
Assumptions
The control panel for the entire model.
Revenue Projections
Projects total construction revenue by month for year one and annually through year five.
Job Cost Model
Breaks out direct project costs by the four main categories that determine job gross margin: materials, direct labor (field crew wages, burden, and benefits), subcontractor costs, and equipment rental.
Overhead & G&A
Covers all costs that don't get allocated to a specific job: office rent and utilities, project management and estimating salaries, office administration staff, vehicles and fuel (for non-billable trucks and company vehicles), insurance (general liability, workers' comp, builder's risk), bonding premiums, accounting and legal fees, software subscriptions, and marketing.
5-Year P&L Summary
An annual summary showing total revenue, total job costs, gross profit, gross margin percentage, total overhead, EBITDA, and net income side by side for each of the five projected years.
Cash Flow Projection
A monthly cash flow model for year one and an annual summary through year five, built specifically for the way construction companies get paid.
Break-Even Analysis
Calculates the annual revenue a construction company needs to cover all fixed and variable costs.
Construction Pro Forma Template Features
- Revenue model by project type (residential, commercial, industrial, specialty) with average contract size
- Job cost breakdown by materials, direct labor, subcontractors, and equipment as % of contract value
- Overhead model separating fixed and variable costs with overhead-as-percent-of-revenue calculation
- Monthly cash flow with retainage tracking and payment timing adjustments for contractor billing cycles
- 5-year annual P&L summary with gross margin, EBITDA, and net margin by year
- Break-even analysis by annual revenue under variable gross margin scenarios
How to Use This Construction Pro Forma Spreadsheet
Start with the Assumptions sheet. Enter your company's current project mix, average contract sizes for each project type, and your typical bid-to-win ratio — this ratio is the most important driver of projected revenue because it determines how much estimating volume you need to generate your target backlog. If you're starting a new company, use industry benchmarks as a baseline: general contractors typically win 1 in 5 to 1 in 8 bids; specialty trades with established relationships can win 1 in 3 to 1 in 4. Set a 12–24 month ramp schedule that reflects how long it takes to build backlog in your market.
Once assumptions are set, review the Job Cost Model sheet and adjust the cost percentages for each project type to match your actual experience. This is the most important customization step — the default percentages are industry averages, but your actual material and labor costs depend heavily on your market, your crew structure, and how you use subcontractors. Verify that the gross margins in the Job Cost Model match what you actually see on your best and worst jobs before using the model for any financial presentation. Then review the Overhead & G&A sheet and enter your actual or projected overhead line items.
From download to lender-ready projections in under an hour
Enter your project mix, contract sizes, and cost structure — the model builds your 5-year revenue, gross margin, overhead, and cash flow analysis automatically.
Why Every Construction Company Needs a Pro Forma
Construction is one of the most cash-intensive industries to finance because of how payment works. Contractors spend money on materials and labor weeks before the owner pays, retainage holds back 5–10% of every invoice until project completion, and payment terms of 30–60 days are standard. A construction company can show strong gross margins on paper and still run out of cash because it's growing faster than its billing cycle allows. That's the specific problem a construction pro forma is built to solve — projecting not just profitability but the cash timing that determines whether a company can fund its own growth or needs a line of credit to bridge the gap.
The two numbers that define construction financial health are gross margin per project (20–35% is typical for general contractors; specialty trades can run higher) and overhead as a percentage of revenue (healthy companies keep this at 10–18%). A contractor with a 28% gross margin and 15% overhead runs at 13% EBITDA — a solid business. A contractor with the same 28% gross margin but 22% overhead is barely breaking even. Overhead percentage almost always improves as revenue grows, because most overhead costs are fixed — the project manager, the office rent, the insurance premiums don't double when revenue doubles. This is the core scaling logic that makes a construction pro forma useful: it shows at what revenue level the business becomes meaningfully profitable.
Construction Industry at a Glance
Financial templates built for construction companies — from general contractors to specialty trades. Pre-loaded with job costing categories, bid tracking, and project-based financials.
Revenue Drivers
- Project contracts
- Change orders
- Service & maintenance
- Material markups
Key Cost Categories
- Materials
- Labor (direct)
- Subcontractors
- Equipment rental
- Permits & insurance
- Overhead
Typical Margins
Gross: 20-35% · Net: 2-7%
Seasonality
Peak activity spring through fall; winter slowdown in northern climates. Year-end push to close projects.
Key Performance Indicators
Construction Pro Forma Template FAQ
More Construction Templates
Construction Balance Sheet Template for Excel
$29
Construction Budget Template for Excel
$29
Construction Business Plan Template for Excel
$39
Construction Cash Flow Template for Excel
$29
Construction Expense Tracker Template for Excel
$29
Construction Financial Model Template for Excel
$29
Construction Income Statement Template for Excel
$29
Construction Invoice Template for Excel
$29
Construction KPI Dashboard Template for Excel
$29
Construction P&L Template for Excel
$29
Construction Project Budget Template for Excel
$29
Construction Sales Forecast Template for Excel
$29
Construction Business Valuation Template for Excel
$29
Construction Pro Forma Template
$29