Ecommerce Valuation Template
Value an ecommerce business or DTC brand using seller's discretionary earnings multiples, revenue multiples, and DCF analysis — with inputs built around the metrics that drive online retail value.
What's Inside This Ecommerce Valuation Template
This template includes 5 worksheets, each designed for a specific part of your ecommerce financial workflow:
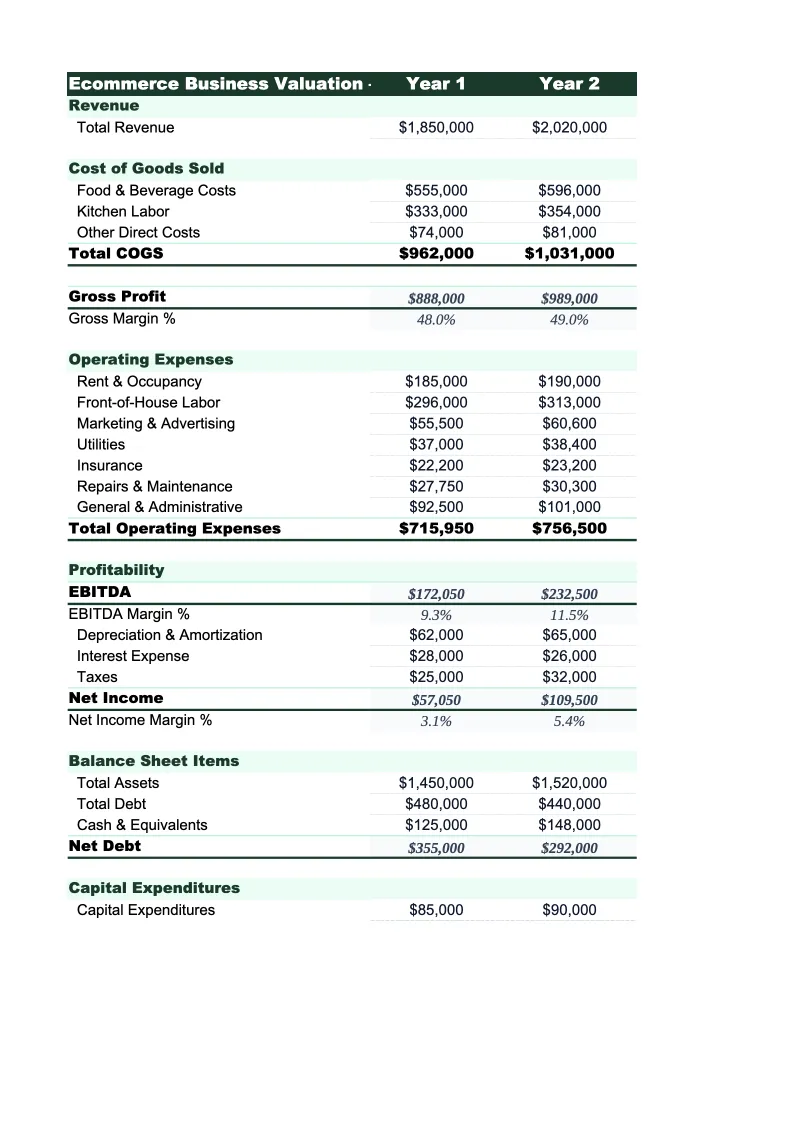
Assumptions
The input sheet where you enter all financial and operational data that feeds the three valuation methods.
Income Approach
Values the business based on its earning power using two methods: a capitalized earnings method and a five-year discounted cash flow model.
Market Approach
Values the business by comparing it to actual ecommerce transactions using revenue multiples and SDE multiples.
Asset-Based Approach
Estimates the net asset value of the ecommerce business by cataloging its tangible and intangible assets minus liabilities.
Valuation Summary
Consolidates all three valuation methods into a weighted average conclusion.
Ecommerce Valuation Template Features
- SDE and revenue multiple methods with ecommerce industry benchmarks by business type
- Comparable transaction tracker for up to 8 ecommerce deals
- Intangible asset valuation: email list, SEO equity, domain, brand, and customer database
- 5-year DCF with terminal value for high-growth DTC brand analysis
- Channel mix inputs (DTC, Amazon, wholesale, subscription) with impact on multiple
- Weighted average summary with sensitivity table across multiple and growth scenarios
How to Use This Ecommerce Business Valuation Spreadsheet
Start with the Assumptions sheet. Enter your store's trailing twelve-month revenue broken out by channel, then work through the expense categories — COGS, fulfillment, platform fees, ad spend, and operating overhead. The most important step is building accurate SDE: add back your owner salary, owner benefits, depreciation, amortization, and any one-time costs that won't repeat (a one-time inventory write-down, a website redesign, a legal expense). Buyers will scrutinize this add-back list closely, so document each adjustment. Also enter the operational metrics at the bottom of the sheet — AOV, CAC, repeat purchase rate, monthly revenue growth rate, and email list size — because these directly affect the multiple buyers are willing to pay.
With your earnings calculated, move to the Income Approach sheet and select the SDE multiple that fits your business profile. Use the reference table to find the range for your business type, then adjust up or down based on traffic diversification, revenue growth rate, customer cohort strength, and channel concentration. On the Market Approach sheet, add comp transactions from broker databases like Flippa, Empire Flippers, or FE International — their published transaction data is the most reliable source for ecommerce comps. On the Asset-Based sheet, enter your inventory at cost and work through the intangible assets, particularly the email list and SEO traffic values, which can be material for DTC brands with strong organic and owned-channel performance.
15 minutes from download to your first ecommerce valuation
Download the template, enter your store's financials and channel data, and get a cross-checked valuation using SDE multiples, comparable transactions, and asset-based methods — all in one spreadsheet.
How to Value an Ecommerce Business
Ecommerce businesses are valued primarily on Seller's Discretionary Earnings — the normalized profit available to a working owner-operator after all operating expenses, before owner compensation. Unlike SaaS businesses that trade on revenue multiples at scale, most small to mid-size ecommerce businesses (under $5M in annual revenue) are valued on SDE multiples, typically in the 2x to 4x range. A Shopify store generating $150,000 in SDE at a 3x multiple implies a $450,000 purchase price — the buyer expects that earnings stream to continue so they can recover the investment in about three years from the business's cash flows. The multiple reflects the market's confidence in the durability of those earnings.
Several factors drive ecommerce multiples above or below the midmarket range. Businesses command premium multiples when revenue is diversified across channels (owned website, email, organic search, Amazon, retail wholesale), customer cohort data shows strong retention and repeat purchase rates, gross margins are above 45%, the brand has proprietary or exclusive products, and traffic is not dependent on paid ads alone. Multiples compress sharply when the business is single-channel (pure Amazon FBA is currently trading at lower multiples due to policy risk and fee increases), customer acquisition is entirely paid, SKU concentration is high (one product driving 70%+ of revenue), or the owner is the primary face of the brand. Buyers pay a premium for systems and teams that don't require the founder to remain.
Ecommerce Industry at a Glance
Financial templates built for ecommerce businesses — from Shopify stores to Amazon sellers. Pre-loaded with SKU-level line items, platform fee categories, return tracking, and the metrics that drive online retail profitability.
Revenue Drivers
- Direct-to-consumer product sales
- Wholesale and B2B orders
- Marketplace sales (Amazon, eBay, Etsy)
- Subscription or bundle revenue
Key Cost Categories
- Cost of goods sold (inventory)
- Shipping and fulfillment
- Payment processing fees
- Platform and marketplace fees
- Returns and refunds
- Digital advertising and customer acquisition
Typical Margins
Gross: 30-55% · Net: 5-15%
Seasonality
Heavy Q4 concentration around Black Friday, Cyber Monday, and holiday gifting. Many categories also spike in January (post-holiday), back-to-school (August), and Mother's Day.
Key Performance Indicators
Ecommerce Business Valuation Template FAQ
More Ecommerce Templates
Ecommerce Balance Sheet Template for Excel
$29
Ecommerce Budget Template for Excel
$29
E-commerce Business Plan Template for Excel
$39
Ecommerce Cash Flow Template for Excel
$29
Ecommerce Expense Tracker Template for Excel
$29
Ecommerce Financial Model Template for Excel
$29
Ecommerce Income Statement Template for Excel
$29
Ecommerce Invoice Template for Excel
$29
Ecommerce KPI Dashboard Template for Excel
$29
Ecommerce P&L Template for Excel
$29
Ecommerce Pro Forma Template for Excel
$29
Ecommerce Project Budget Template for Excel
$29
Ecommerce Sales Forecast Template for Excel
$29
Ecommerce Valuation Template
$29