Ecommerce Pro Forma Template
Project an ecommerce store's revenue by channel, unit economics, customer acquisition cost, gross margin, and operating cash flow across 5 years — with pre-built formulas for AOV, CAC payback, LTV:CAC ratio, and contribution margin per order.
What's Inside This Ecommerce Pro Forma Template
This template includes 7 worksheets, each designed for a specific part of your ecommerce financial workflow:
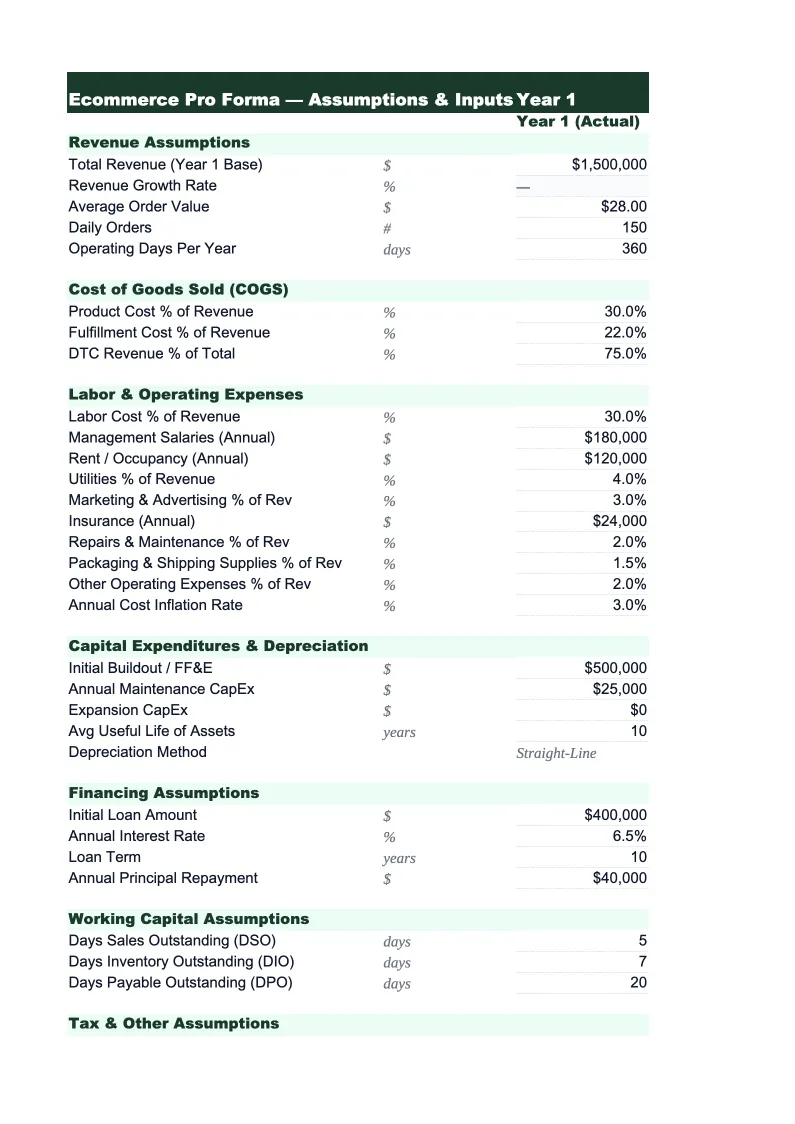
Assumptions
The control panel for the entire model.
Revenue Projections
Projects total ecommerce revenue by month for year one and annually through year five, broken out by sales channel (DTC website, Amazon/marketplaces, wholesale and B2B, and subscription or bundle revenue if applicable).
Unit Economics
Calculates the fully-loaded gross profit per order after accounting for every cost that touches the transaction: product cost (COGS as a percentage of selling price, by channel since DTC and wholesale have different price points), outbound shipping and fulfillment (pick, pack, and carrier cost), inbound freight and landed cost allocation per unit, payment processing fees (typically 2.5–3.5% for Stripe or PayPal on DTC; platform take rates of 8–15% for Amazon FBA), return processing and restocking costs, and marketplace or app fees.
Customer Acquisition
Models your customer acquisition economics and marketing spend across channels — paid social (Meta, TikTok), paid search (Google Shopping, branded), email and SMS, influencer and affiliate, and organic search.
Operating Expenses
Covers all costs below contribution margin: headcount (founders, marketing, operations, customer service, and any warehouse or 3PL management roles, each with salary and benefits), technology and platform fees (Shopify or equivalent monthly plan, app subscriptions, email platform, analytics tools), warehouse and 3PL costs that aren't allocated per order (monthly 3PL storage fees, inbound receiving charges, SLA fees), general and administrative costs (accounting, legal, insurance, bank fees), and other overhead.
5-Year P&L Summary
An annual summary showing gross revenue, returns and refunds, net revenue, total COGS, gross profit, contribution margin, total customer acquisition cost, total operating expenses, EBITDA, and net income side by side for each of the five projected years.
Cash Flow Projection
A monthly cash flow model for year one and annual summary through year five, built around the specific cash timing challenges of ecommerce.
Ecommerce Pro Forma Template Features
- Revenue model by channel (DTC, Amazon, wholesale) with seasonal distribution and ramp schedule
- Unit economics sheet calculating contribution margin per order net of fulfillment, payment, and platform fees
- Customer acquisition model with CAC by channel, LTV:CAC ratio, and payback period calculation
- Monthly cash flow with inventory pre-purchase timing and marketplace remittance delay modeling
- 5-year P&L summary with gross margin, contribution margin, CAC-to-revenue ratio, and net margin by year
- Operating leverage analysis showing how fixed costs compress as a percentage of revenue at scale
How to Use This Ecommerce Pro Forma Spreadsheet
Start with the Assumptions sheet. Enter your AOV, projected monthly order volume, channel mix, return rate, and unit-level cost structure — product cost as a percentage of revenue, fulfillment cost per order, and payment processing rate. If you're projecting a new store, use your product category's typical AOV as a benchmark and set order volume to a conservative year-one target based on your planned marketing spend and organic traction. The ramp schedule is critical for a new brand: most DTC stores run at 30–50% of their target monthly order volume in months one through three as ad accounts optimize and organic search builds. Set that ramp conservatively — investors know the pattern and will push back on projections that assume full-speed revenue from month one.
Once the Assumptions sheet is dialed in, review the Unit Economics sheet and verify that your contribution margin per order is positive across all channels before you add marketing spend. This is the ecommerce founder's gut-check: if product cost, fulfillment, payment fees, and returns together consume more than 70–75% of your selling price, you don't have enough contribution margin to fund customer acquisition at any meaningful scale. Then move to the Customer Acquisition sheet and enter your planned marketing spend by channel with realistic CAC estimates — use actual CPM and conversion rate data if you have it, or category benchmarks if you're starting from scratch. The LTV:CAC and payback period outputs will tell you quickly whether your acquisition model is fundable.
From download to investor-ready projections in under an hour
Enter your AOV, order volume, unit costs, and marketing spend — the model builds your channel revenue, contribution margin, LTV:CAC ratio, and 5-year cash flow automatically.
Why Every Ecommerce Business Needs a Pro Forma
Ecommerce is one of the most capital-efficient businesses to start but one of the easiest to underestimate financially. A Shopify store can be live in 48 hours, but the economics of scaling it profitably are complex: gross margins of 30–55% sound healthy until you subtract fulfillment (often $5–12 per order), payment processing (2.5–3.5%), platform fees, and return costs, leaving contribution margins of 15–30% before any marketing spend. For a DTC brand spending $30 on CAC to acquire a customer with a $60 AOV and 25% contribution margin, the math breaks immediately — $15 of contribution margin minus $30 of CAC means the first purchase loses $15. The business only works if that customer buys again, and a pro forma forces you to make that math explicit before you've spent real money discovering it.
The financial metrics that define ecommerce health are gross margin (30–55% for most product categories; beauty and apparel run higher, electronics lower), contribution margin after fulfillment and fees (target above 20–25% to have room for profitable marketing spend), CAC payback period (under 12 months for most brands; under 6 months for consumer subscription), and LTV:CAC ratio (above 3:1 is the standard investor threshold). Amazon and marketplace revenue looks attractive for volume but often runs 15–25 points lower in net contribution margin than DTC revenue once you account for referral fees (8–15%), FBA fees ($3–8 per unit), advertising cost of sale (10–20% for competitive categories), and the absence of customer data ownership. A pro forma that models channels separately — not just blended revenue — surfaces this tradeoff before you've built a business dependent on a channel that doesn't support sustainable margins.
Ecommerce Industry at a Glance
Financial templates built for ecommerce businesses — from Shopify stores to Amazon sellers. Pre-loaded with SKU-level line items, platform fee categories, return tracking, and the metrics that drive online retail profitability.
Revenue Drivers
- Direct-to-consumer product sales
- Wholesale and B2B orders
- Marketplace sales (Amazon, eBay, Etsy)
- Subscription or bundle revenue
Key Cost Categories
- Cost of goods sold (inventory)
- Shipping and fulfillment
- Payment processing fees
- Platform and marketplace fees
- Returns and refunds
- Digital advertising and customer acquisition
Typical Margins
Gross: 30-55% · Net: 5-15%
Seasonality
Heavy Q4 concentration around Black Friday, Cyber Monday, and holiday gifting. Many categories also spike in January (post-holiday), back-to-school (August), and Mother's Day.
Key Performance Indicators
Ecommerce Pro Forma Template FAQ
More Ecommerce Templates
Ecommerce Balance Sheet Template for Excel
$29
Ecommerce Budget Template for Excel
$29
E-commerce Business Plan Template for Excel
$39
Ecommerce Cash Flow Template for Excel
$29
Ecommerce Expense Tracker Template for Excel
$29
Ecommerce Financial Model Template for Excel
$29
Ecommerce Income Statement Template for Excel
$29
Ecommerce Invoice Template for Excel
$29
Ecommerce KPI Dashboard Template for Excel
$29
Ecommerce P&L Template for Excel
$29
Ecommerce Project Budget Template for Excel
$29
Ecommerce Sales Forecast Template for Excel
$29
Ecommerce Business Valuation Template for Excel
$29
Ecommerce Pro Forma Template
$29