Ecommerce Financial Model Template
Project revenue by channel, model your unit economics, and track the cash tied up in inventory — built for DTC brands, Shopify stores, and marketplace sellers.
What's Inside This Ecommerce Financial Model Template
This template includes 8 worksheets, each designed for a specific part of your ecommerce financial workflow:
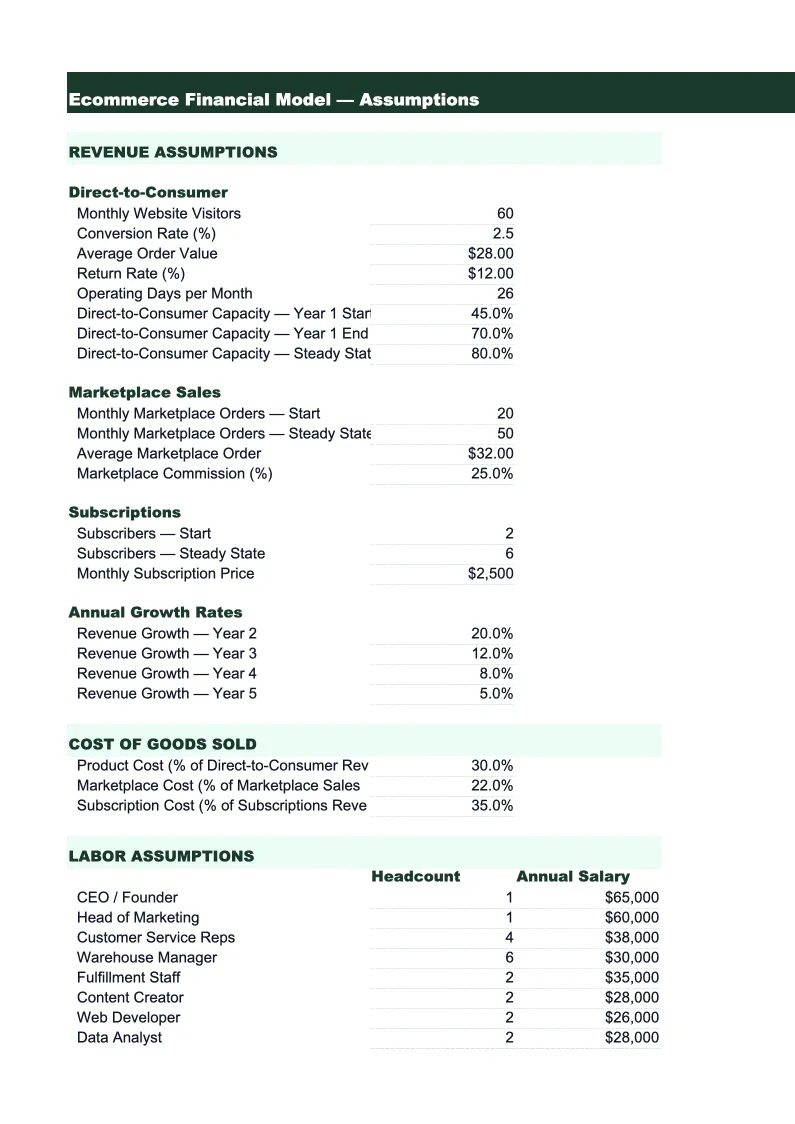
Assumptions
The control panel for the entire model.
Revenue Model
A month-by-month revenue build broken out by sales channel: direct-to-consumer (your own website), Amazon or other marketplaces, wholesale accounts, and subscription or bundle revenue if applicable.
Unit Economics
The contribution margin calculation that tells you whether each order is profitable after variable costs.
P&L
A 24-month income statement with ecommerce-specific cost categories.
Inventory & COGS
Inventory planning is one of the most cash-intensive parts of running an ecommerce business, and this sheet models it properly.
Cash Flow
A monthly cash flow statement that accounts for the timing differences that make ecommerce cash flow uniquely challenging.
Marketing Budget
A channel-by-channel paid marketing budget with ROAS (Return on Ad Spend) and CAC tracking.
Dashboard
A one-page summary with charts and key metrics designed for monthly reviews, investor updates, or board presentations.
Ecommerce Financial Model Template Features
- Revenue model by channel: DTC, Amazon, wholesale, and subscription built separately
- Contribution margin per order by channel after COGS, shipping, fees, and returns
- Inventory cash flow model with supplier lead time and working capital calculation
- LTV:CAC ratio and CAC payback by channel with ROAS tracking
- 24-month P&L with ecommerce-specific cost categories (3PL, platform fees, ad spend)
- Dashboard with gross margin, AOV, return rate, and cash runway metrics
How to Use This Ecommerce Financial Model Spreadsheet
Start with the Assumptions sheet. Fill in your current monthly order volume by channel, average order value, and gross margin for each product category. If you're not sure about gross margin, use total COGS divided by net revenue from your last income statement — that number is your baseline. Enter your return rate (most ecommerce businesses run 10–30% depending on category), your shipping cost per order, and your platform fee percentages. Don't need every number perfect on day one — use your best estimates and refine them as you go.
Once assumptions are in, review the Revenue Model sheet to confirm the channel mix and growth trajectory look right. Then move to the Unit Economics sheet and check your contribution margin per order by channel. If a channel shows negative or near-zero contribution margin, that's a signal — either your CAC is too high for that channel or the fees are eating the margin. The Marketing Budget sheet is where you'll allocate spend across paid search, paid social, and other channels and see ROAS by channel. Spend time here if paid marketing is a meaningful part of your cost structure.
15 minutes from download to your first ecommerce forecast
Download the template, enter your channel revenue and cost assumptions, and see your full financial picture — contribution margin, inventory cash needs, and CAC by channel included.
Why Every Ecommerce Business Needs a Financial Model
Ecommerce P&Ls are famously misleading if you look at gross margin alone. An online store might show 45% gross margin after COGS, but by the time you subtract shipping, payment processing (typically 2.9% + $0.30 per transaction), marketplace fees (Amazon charges 8–15% of revenue depending on category), and the cost of processing returns, contribution margin often falls to 15–25% — and that's before you've spent a dollar on customer acquisition. A financial model that calculates contribution margin per order by channel shows you the real profitability of each sales channel and whether your blended CAC makes sense against that margin.
The other number that surprises most ecommerce founders is how much cash inventory consumes as you scale. If you're doing $50K/month in revenue at 40% gross margin and growing 20% month over month, you need to be buying inventory well before that revenue hits — and your supplier probably requires payment net 30 or net 60, with lead times of 4–12 weeks depending on whether you're sourcing domestically or overseas. A business generating solid operating income on paper can still run out of cash because inventory investment scales faster than receivables. The Inventory & COGS sheet models this timing gap explicitly so you can see cash needs 90 days ahead instead of discovering the shortfall the week you need to place an order.
Ecommerce Industry at a Glance
Financial templates built for ecommerce businesses — from Shopify stores to Amazon sellers. Pre-loaded with SKU-level line items, platform fee categories, return tracking, and the metrics that drive online retail profitability.
Revenue Drivers
- Direct-to-consumer product sales
- Wholesale and B2B orders
- Marketplace sales (Amazon, eBay, Etsy)
- Subscription or bundle revenue
Key Cost Categories
- Cost of goods sold (inventory)
- Shipping and fulfillment
- Payment processing fees
- Platform and marketplace fees
- Returns and refunds
- Digital advertising and customer acquisition
Typical Margins
Gross: 30-55% · Net: 5-15%
Seasonality
Heavy Q4 concentration around Black Friday, Cyber Monday, and holiday gifting. Many categories also spike in January (post-holiday), back-to-school (August), and Mother's Day.
Key Performance Indicators
Ecommerce Financial Model Template FAQ
More Ecommerce Templates
Ecommerce Balance Sheet Template for Excel
$29
Ecommerce Budget Template for Excel
$29
E-commerce Business Plan Template for Excel
$39
Ecommerce Cash Flow Template for Excel
$29
Ecommerce Expense Tracker Template for Excel
$29
Ecommerce Income Statement Template for Excel
$29
Ecommerce Invoice Template for Excel
$29
Ecommerce KPI Dashboard Template for Excel
$29
Ecommerce P&L Template for Excel
$29
Ecommerce Pro Forma Template for Excel
$29
Ecommerce Project Budget Template for Excel
$29
Ecommerce Sales Forecast Template for Excel
$29
Ecommerce Business Valuation Template for Excel
$29
More Financial Model Templates
Ecommerce Financial Model Template
$29