Ecommerce KPI Dashboard Template
Track average order value, customer acquisition cost, ROAS, return rate, and the other KPIs that separate profitable ecommerce stores from ones that are just busy.
What's Inside This Ecommerce KPI Dashboard Template
This template includes 5 worksheets, each designed for a specific part of your ecommerce financial workflow:
KPI Dashboard
The main visual overview showing your store's critical performance metrics at a glance.
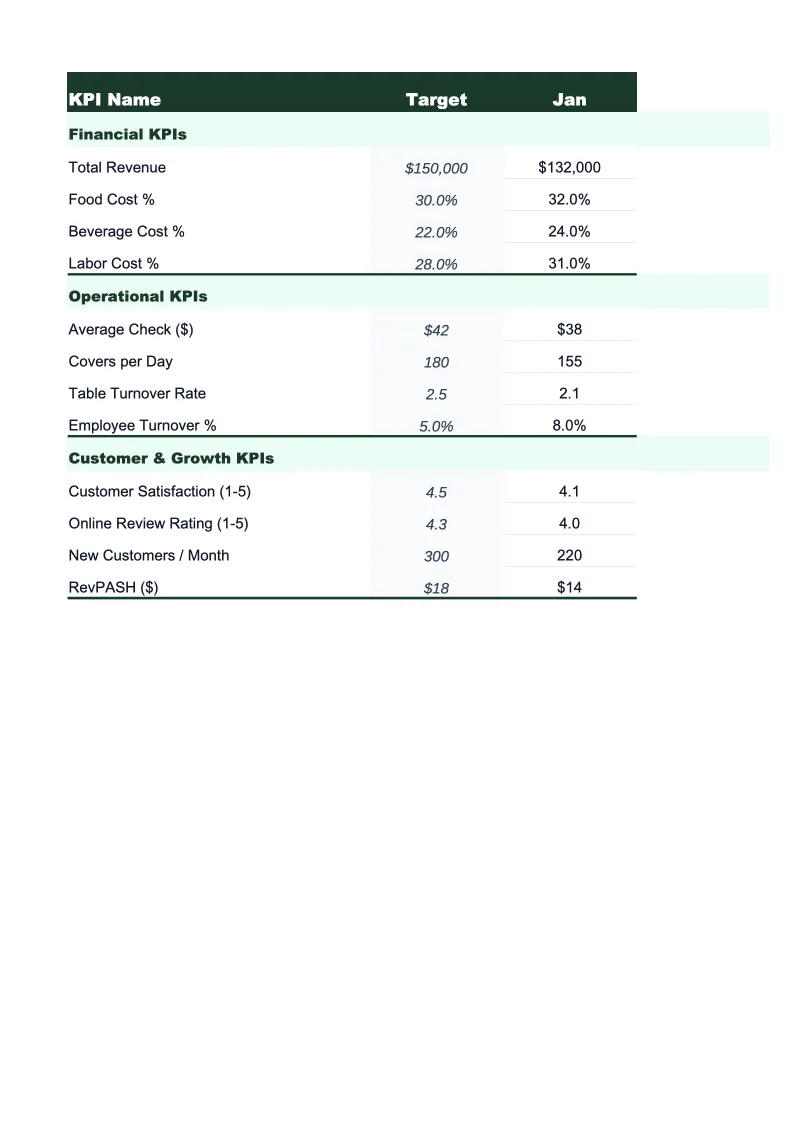
Monthly Scorecard
Set your targets for each KPI at the start of the month, then enter actuals as you close the period.
Channel Performance
A dedicated breakdown of revenue, orders, and profitability by sales channel — direct-to-consumer website, Amazon, eBay, Etsy, wholesale, and any other channel you run.
Customer Metrics
Tracks the customer-side KPIs that drive long-term store profitability — the numbers that don't show up on a P&L but explain why two stores with the same revenue can have very different futures.
12-Month Trends
A rolling 12-month view of your most important KPIs plotted as line and bar charts.
Ecommerce KPI Dashboard Features
- 28 pre-loaded ecommerce KPIs including AOV, CAC, ROAS, gross margin, and repeat purchase rate
- Color-coded status indicators — green/yellow/red against your monthly targets
- Channel performance breakdown with contribution margin per sales channel
- Customer metrics tracker with CAC-to-LTV ratio and 60/90/180-day cohort table
- Cart abandonment rate and conversion rate tracking with benchmark ranges built in
- Rolling 12-month trend charts for ROAS, AOV, gross margin, and customer acquisition cost
How to Use This Ecommerce KPI Spreadsheet
Start with the Monthly Scorecard and set your targets for each KPI before the month begins. If you don't have established benchmarks yet, the template includes industry reference ranges for the most common metrics — AOV, ROAS, CAC, gross margin, and cart abandonment rate are all annotated with typical ranges by store type so you have a starting point. Setting targets takes about 15 minutes for a new store; if you've been running for a while, use your prior three-month averages as your baseline.
At the end of each month, pull your actual figures from Shopify, Amazon Seller Central, Google Analytics, and your ad platform dashboards, then enter them into the Monthly Scorecard. The dashboard and trend charts update automatically. The Channel Performance sheet is worth filling in at the same time — the 10 minutes it takes to enter revenue and ad spend by channel gives you a clearer read on channel profitability than any platform dashboard will, because it's the only place you see all channels side by side on a level playing field.
15 minutes from download to your first KPI review
Download the template, set your targets, and start tracking the metrics that tell you whether your ecommerce store's unit economics actually work.
Why Every Ecommerce Store Needs a KPI Dashboard
Ecommerce is a business where the financials can look fine while the underlying unit economics are quietly breaking down. A store generating $500,000 in revenue with a 40% gross margin sounds healthy until you discover that CAC is $85, average order value is $60, and only 18% of customers ever buy twice. At those numbers, you're acquiring customers at a loss and the business only survives as long as new customer volume holds up. The operators who catch this early are the ones tracking the right KPIs every month — not just revenue and orders, but the metrics that tell you whether each sale is building a durable business or just burning ad spend.
The KPIs that matter most in ecommerce fall into three buckets. Acquisition and marketing metrics — ROAS, CAC, cost per click, and email-attributed revenue — tell you whether your spending is generating profitable customers or just volume. Order and operational metrics — AOV, conversion rate, cart abandonment rate, fulfillment rate, and return rate — tell you whether the storefront and product mix are working. Retention and profitability metrics — repeat purchase rate, customer lifetime value, gross margin by category, and contribution margin by channel — tell you whether the business has a real long-term foundation. Industry benchmarks: ecommerce conversion rates typically run 1.5–4% for direct-to-consumer sites; ROAS above 3x is generally considered healthy for most categories; gross margins of 30–55% are typical depending on product type and whether you're selling branded or commoditized goods.
Ecommerce Industry at a Glance
Financial templates built for ecommerce businesses — from Shopify stores to Amazon sellers. Pre-loaded with SKU-level line items, platform fee categories, return tracking, and the metrics that drive online retail profitability.
Revenue Drivers
- Direct-to-consumer product sales
- Wholesale and B2B orders
- Marketplace sales (Amazon, eBay, Etsy)
- Subscription or bundle revenue
Key Cost Categories
- Cost of goods sold (inventory)
- Shipping and fulfillment
- Payment processing fees
- Platform and marketplace fees
- Returns and refunds
- Digital advertising and customer acquisition
Typical Margins
Gross: 30-55% · Net: 5-15%
Seasonality
Heavy Q4 concentration around Black Friday, Cyber Monday, and holiday gifting. Many categories also spike in January (post-holiday), back-to-school (August), and Mother's Day.
Key Performance Indicators
Ecommerce KPI Dashboard Template FAQ
More Ecommerce Templates
Ecommerce Balance Sheet Template for Excel
$29
Ecommerce Budget Template for Excel
$29
E-commerce Business Plan Template for Excel
$39
Ecommerce Cash Flow Template for Excel
$29
Ecommerce Expense Tracker Template for Excel
$29
Ecommerce Financial Model Template for Excel
$29
Ecommerce Income Statement Template for Excel
$29
Ecommerce Invoice Template for Excel
$29
Ecommerce P&L Template for Excel
$29
Ecommerce Pro Forma Template for Excel
$29
Ecommerce Project Budget Template for Excel
$29
Ecommerce Sales Forecast Template for Excel
$29
Ecommerce Business Valuation Template for Excel
$29
More KPI Dashboard Templates
Ecommerce KPI Dashboard Template
$29