Ecommerce Sales Forecast Template
Forecast your online store's revenue by traffic source, product category, and sales channel — built around the conversion-driven metrics that determine ecommerce revenue.
What's Inside This Ecommerce Sales Forecast Template
This template includes 6 worksheets, each designed for a specific part of your ecommerce financial workflow:
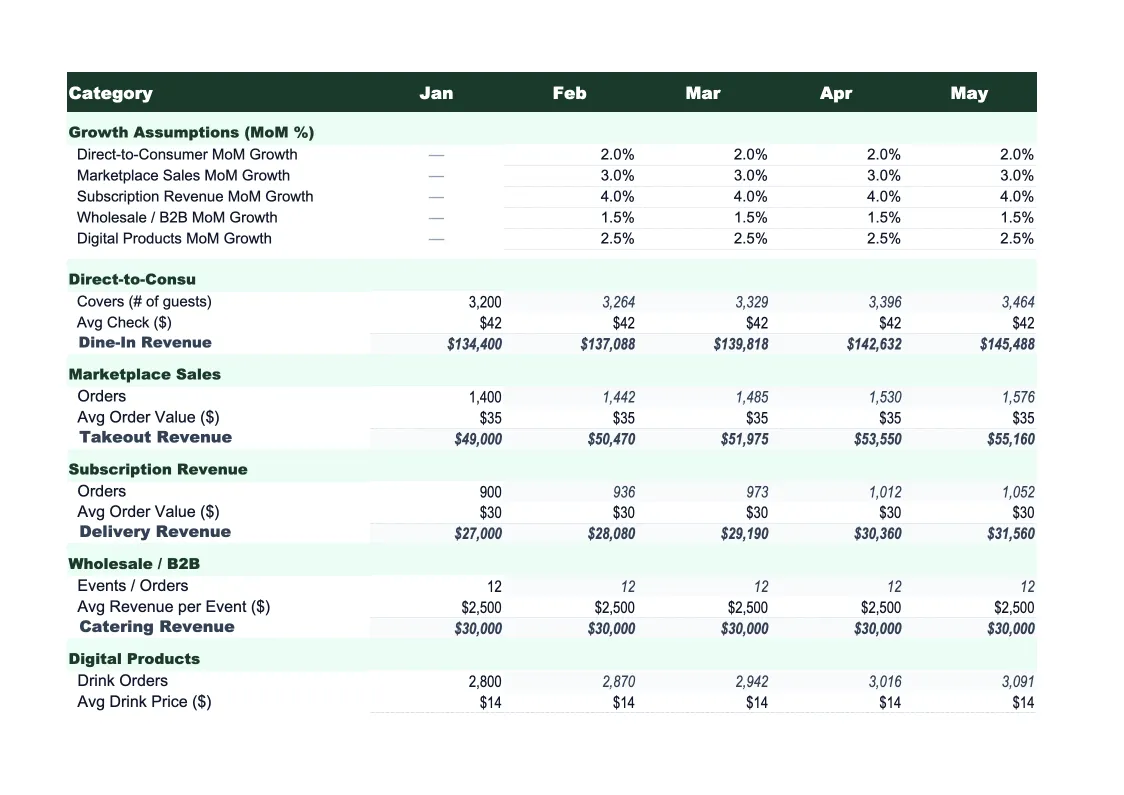
Assumptions & Drivers
The core input sheet where you define the revenue drivers that power every other sheet in the model.
Monthly Revenue Forecast
A 12-month projection of gross revenue, returns, and net revenue broken out by sales channel — direct-to-consumer website, Amazon or marketplace, and wholesale or B2B.
SKU & Category Forecast
A product-level breakdown of projected unit sales, revenue, and gross margin by SKU category.
Traffic & Conversion Planner
A dedicated worksheet for modeling your traffic growth and conversion rate assumptions across each acquisition channel.
Forecast vs Actual
A tracking sheet for entering your realized monthly performance against the forecast as the year progresses.
Dashboard
A one-page visual summary that pulls KPIs and charts from all other sheets automatically.
Ecommerce Sales Forecast Template Features
- Traffic-and-conversion driver model: sessions × CVR × AOV by channel
- SKU and product category forecast with unit economics and gross margin
- Multi-channel breakdown: DTC website, Amazon/marketplace, and wholesale
- Return rate adjustment that flows through to net revenue automatically
- Seasonal index with Q4 weighting for Black Friday and holiday peak
- Forecast vs actual variance tracker with color-coded monthly alerts
How to Use This Ecommerce Sales Forecast Spreadsheet
Start with the Assumptions & Drivers sheet. Pull up your Shopify Analytics, Google Analytics, or your ad platform dashboards and enter your baseline traffic by source, conversion rates, and average order value. If you're forecasting for a new product line or a new channel, use industry benchmarks: a typical Shopify store converts at 1.5–3.5% depending on traffic quality, and ecommerce AOV averages around $65–$130 depending on category. Set your seasonal multipliers before leaving this sheet — even rough estimates for Q4 weighting will make the forecast significantly more useful than a flat-line projection.
Move to the SKU & Category Forecast sheet and map out your product mix. Group your catalog into logical categories and enter the expected unit volumes, prices, COGS, and sell-through rates for each. This step takes the most time but delivers the most insight — ecommerce businesses where one product category drives 70% of volume but only 40% of margin need to see that discrepancy before making inventory and ad spend decisions, not after. Once the category data is in, the Monthly Revenue Forecast and Dashboard update automatically.
15 minutes from download to your first revenue projection
Download the template, enter your traffic sources, conversion rates, and product categories, and get a 12-month ecommerce forecast with channel breakdowns, SKU margins, and a variance tracker included.
Why Every Ecommerce Business Needs a Sales Forecast Template
Ecommerce revenue is more predictable than most operators think, because it runs on a small number of observable inputs. Sessions times conversion rate times average order value equals revenue — and all three of those numbers are tracked in real time in every analytics platform. The problem isn't data availability; it's that most online stores don't have a structured way to project those inputs forward and test assumptions about what changes them. A sales forecast built around traffic, conversion, and order value drivers forces that clarity, which is why ecommerce businesses that use driver-based forecasting make better ad spend decisions and carry less excess inventory than those that rely on gut feel or last year's growth rate.
Ecommerce seasonality is extreme compared to most industries. Black Friday and Cyber Monday alone can produce 3–5x a normal week's revenue, and Q4 as a whole typically represents 30–40% of annual sales for consumer product brands. That concentration means a flat-line monthly forecast understates Q4 revenue and overstates Q1, which leads to inventory misjudgments, ad budget misallocation, and cash flow surprises. A forecast with an explicit seasonality model lets you plan inventory orders, set advertising budgets, and anticipate fulfillment capacity needs 8–12 weeks ahead of peak — which is roughly the lead time required to act on most of those decisions.
Ecommerce Industry at a Glance
Financial templates built for ecommerce businesses — from Shopify stores to Amazon sellers. Pre-loaded with SKU-level line items, platform fee categories, return tracking, and the metrics that drive online retail profitability.
Revenue Drivers
- Direct-to-consumer product sales
- Wholesale and B2B orders
- Marketplace sales (Amazon, eBay, Etsy)
- Subscription or bundle revenue
Key Cost Categories
- Cost of goods sold (inventory)
- Shipping and fulfillment
- Payment processing fees
- Platform and marketplace fees
- Returns and refunds
- Digital advertising and customer acquisition
Typical Margins
Gross: 30-55% · Net: 5-15%
Seasonality
Heavy Q4 concentration around Black Friday, Cyber Monday, and holiday gifting. Many categories also spike in January (post-holiday), back-to-school (August), and Mother's Day.
Key Performance Indicators
Ecommerce Sales Forecast Template FAQ
More Ecommerce Templates
Ecommerce Balance Sheet Template for Excel
$29
Ecommerce Budget Template for Excel
$29
E-commerce Business Plan Template for Excel
$39
Ecommerce Cash Flow Template for Excel
$29
Ecommerce Expense Tracker Template for Excel
$29
Ecommerce Financial Model Template for Excel
$29
Ecommerce Income Statement Template for Excel
$29
Ecommerce Invoice Template for Excel
$29
Ecommerce KPI Dashboard Template for Excel
$29
Ecommerce P&L Template for Excel
$29
Ecommerce Pro Forma Template for Excel
$29
Ecommerce Project Budget Template for Excel
$29
Ecommerce Business Valuation Template for Excel
$29
More Sales Forecast Templates
Ecommerce Sales Forecast Template
$29