Ecommerce P&L Template
Track revenue, COGS, ad spend, platform fees, and net margin for your online store — with a P&L built for ecommerce, not a generic spreadsheet you have to rebuild from scratch.
What's Inside This Ecommerce P&L Template
This template includes 4 worksheets, each designed for a specific part of your ecommerce financial workflow:
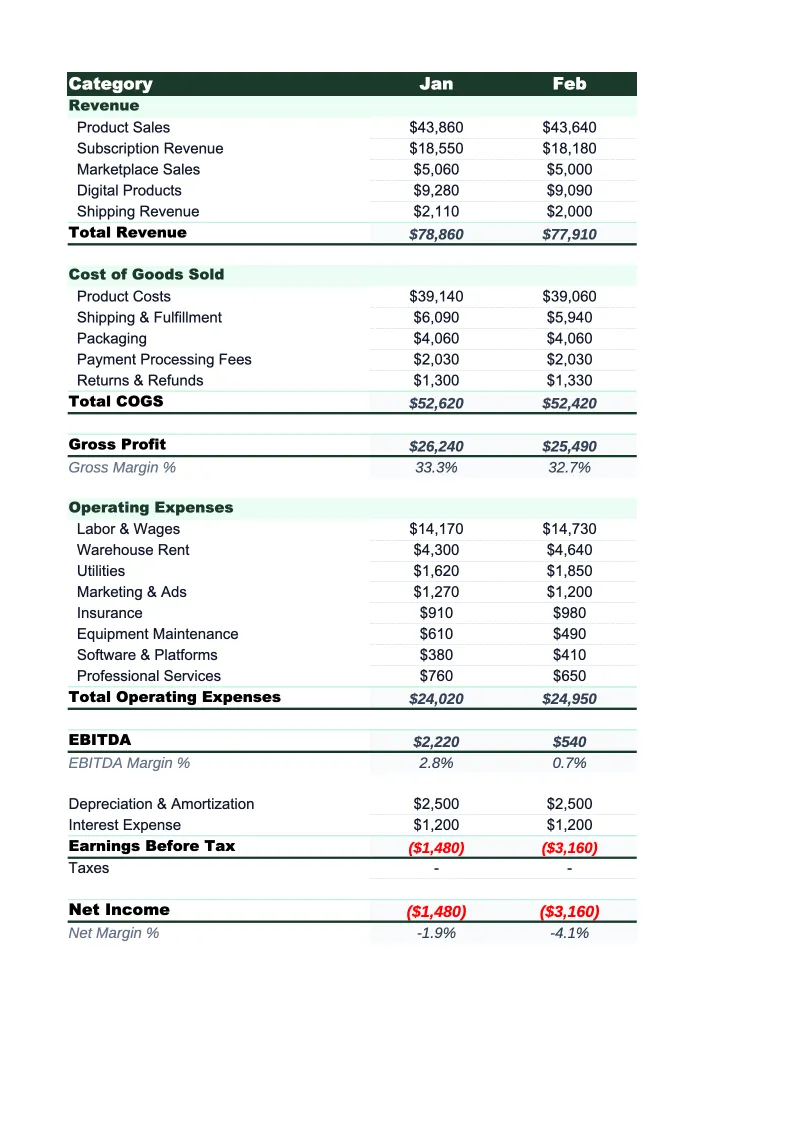
Monthly P&L
The core worksheet where you record each month's revenue and expenses.
Annual P&L
A 12-month view that pulls from the Monthly P&L sheet automatically.
SKU Margin Analysis
A dedicated worksheet for analyzing profitability by product or product category.
Dashboard
A one-page visual summary with pre-built charts and the KPIs that matter most to ecommerce operators.
Ecommerce P&L Template Features
- Revenue split by channel: DTC, Amazon/marketplace, wholesale, and subscriptions
- Ad spend tracking broken out by platform (Meta, Google, TikTok)
- SKU-level margin analysis with per-unit fee and fulfillment cost inputs
- Platform and marketplace fee tracking (Shopify, Amazon referral, FBA)
- Returns and refunds as a standalone expense line
- 12-month annual P&L with gross margin % and net margin auto-calculated
How to Use This Ecommerce P&L Spreadsheet
Download the .xlsx file and open it in Excel or Google Sheets — no macros, no plugins, nothing to install. Start with the Monthly P&L sheet. Review the pre-loaded revenue and expense categories and adjust them to match your store's setup: rename the marketplace revenue lines if you only sell on one platform, add a revenue line for bundles if that's a meaningful part of your business, and remove anything irrelevant. Most ecommerce operators are up and running in 15–20 minutes.
Once the structure is set, enter your monthly revenue and expenses. Your Shopify or WooCommerce dashboard covers revenue and order counts; your ad platforms (Meta Ads Manager, Google Ads) provide spend by channel; and your payment processor or bookkeeping software handles fees and refunds. Fill in the SKU Margin Analysis sheet for your top products — this is where the template pays for itself fastest, because most operators discover that one or two SKUs are eating margin they thought they had. The sheet calculates contribution margin per unit automatically.
15 minutes from download to your first P&L
Download the template, enter last month's numbers, and see your store's gross margin, net income, and ad spend ratio — with SKU-level margin analysis included.
Why Every Ecommerce Store Needs a P&L Template
Ecommerce looks profitable on the surface — high gross margins, no storefront costs, global reach — but the gap between gross and net margin is where the business actually lives. Platform fees, payment processing, digital advertising, fulfillment, and returns can collectively consume 40–60% of revenue, and each one behaves differently depending on your channel mix. A store doing 50% of sales through Amazon will have a fundamentally different cost structure than a DTC-only brand, even at the same revenue level. Without a P&L that breaks these costs down explicitly, you're making decisions about pricing, advertising, and growth based on a number that doesn't reflect what the store actually keeps.
A proper ecommerce P&L structures costs in a way that maps to how online retail actually works. Revenue split by channel matters because each channel has different margin profiles: direct-to-consumer at full price is your best margin, marketplace sales net you less after referral fees and FBA costs, and wholesale typically runs 40–50% below DTC pricing. On the cost side, COGS should separate product cost from inbound freight, and operating expenses should break out digital advertising by platform so you can compare return on ad spend (ROAS) across channels. Listing those costs in a single 'marketing' bucket obscures which channel is actually working.
Ecommerce Industry at a Glance
Financial templates built for ecommerce businesses — from Shopify stores to Amazon sellers. Pre-loaded with SKU-level line items, platform fee categories, return tracking, and the metrics that drive online retail profitability.
Revenue Drivers
- Direct-to-consumer product sales
- Wholesale and B2B orders
- Marketplace sales (Amazon, eBay, Etsy)
- Subscription or bundle revenue
Key Cost Categories
- Cost of goods sold (inventory)
- Shipping and fulfillment
- Payment processing fees
- Platform and marketplace fees
- Returns and refunds
- Digital advertising and customer acquisition
Typical Margins
Gross: 30-55% · Net: 5-15%
Seasonality
Heavy Q4 concentration around Black Friday, Cyber Monday, and holiday gifting. Many categories also spike in January (post-holiday), back-to-school (August), and Mother's Day.
Key Performance Indicators
Ecommerce P&L Template FAQ
More Ecommerce Templates
Ecommerce Balance Sheet Template for Excel
$29
Ecommerce Budget Template for Excel
$29
E-commerce Business Plan Template for Excel
$39
Ecommerce Cash Flow Template for Excel
$29
Ecommerce Expense Tracker Template for Excel
$29
Ecommerce Financial Model Template for Excel
$29
Ecommerce Income Statement Template for Excel
$29
Ecommerce Invoice Template for Excel
$29
Ecommerce KPI Dashboard Template for Excel
$29
Ecommerce Pro Forma Template for Excel
$29
Ecommerce Project Budget Template for Excel
$29
Ecommerce Sales Forecast Template for Excel
$29
Ecommerce Business Valuation Template for Excel
$29
Ecommerce P&L Template
$29