Electrical Cash Flow Template
Manage the gap between material costs, crew payroll, and slow commercial billing cycles with a cash flow template built specifically for electrical contractors.
What's Inside This Electrical Contractor Cash Flow Template
This template includes 5 worksheets, each designed for a specific part of your electrical financial workflow:
Weekly Cash Flow
A 13-week rolling cash flow projection broken down by week — the planning horizon that keeps electrical contractors solvent through commercial billing delays and uneven job starts.
Job Cash Flow
A per-job tracker where you enter the contract value, deposit collected, estimated material cost, labor hours and cost, and expected payment schedule for each active or upcoming job.
Service Call Tracker
A dedicated worksheet for residential service calls, which behave differently from project work: they are smaller dollar amounts, typically paid on completion, and provide the steady daily cash flow that keeps an electrical company solvent between large project payments.
Annual Cash Flow
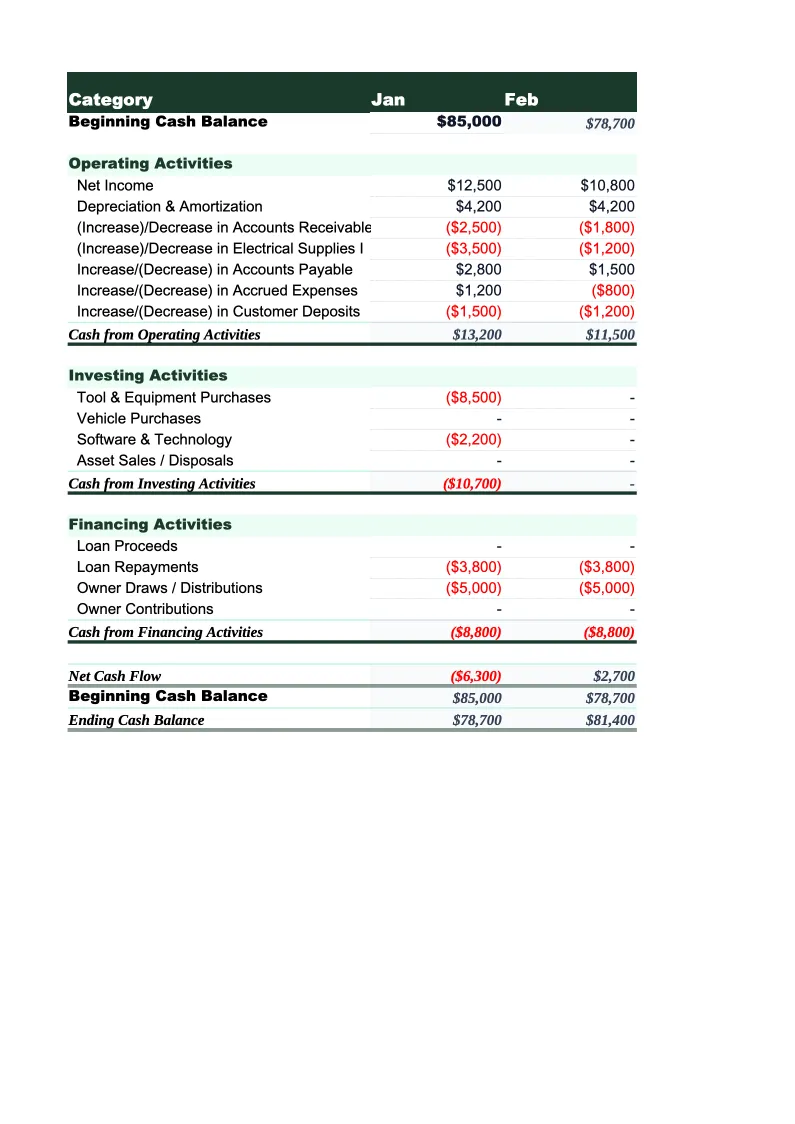
A 12-month cash flow statement that captures the full seasonal pattern of an electrical contracting business.
Dashboard
A single-page visual summary showing current cash balance, total accounts receivable outstanding broken out by job type, 13-week cash runway, and a bar chart of weekly inflows versus outflows.
Electrical Cash Flow Template Features
- 13-week rolling cash flow with electrical-specific line items (service calls, progress billing draws, wire and conduit, crew wages, permits)
- Per-job cash flow tracker showing progress billing schedule vs. material and labor cost by job
- Service call tracker with revenue per call, gross margin, and weekly service revenue totals
- Annual cash flow statement formatted for bank, bonding company, and SBA lender review
- Ending cash balance and weekly runway calculated automatically
- Visual dashboard with cash position, AR by job type, backlog weeks, and revenue per man-hour
How to Use This Electrical Cash Flow Spreadsheet
Start with the Weekly Cash Flow sheet. Download the file and open it in Excel or Google Sheets — no macros or plugins required. Enter your current bank balance in the starting cash cell, then fill in expected inflows for the next 13 weeks: progress billing draws you expect to submit and collect, service call revenue based on your current call volume, panel upgrade and installation payments, and any new construction draw schedule receipts. Use your active job list and accounts receivable aging report as your source. Most electrical contractors can complete the initial setup in 20–30 minutes the first time through.
Set up the Job Cash Flow sheet for every active and booked commercial or project job. Enter the contract value, mobilization deposit received, total material cost estimate, your expected labor hours and cost, and the draw schedule milestones. For commercial work on AIA billing cycles, enter each draw request amount and the typical net days to payment from your GC — usually net 30, sometimes net 45–60 on larger projects. The sheet shows you, job by job, how much cash each project requires before the next draw arrives, and the aggregate view across all active jobs tells you the total cash requirement at any point in the schedule.
15 minutes from download to your first cash flow projection
Download the template, enter your active jobs and service call volume, and see your electrical company's 13-week cash position before the next material order is due.
Why Electrical Contractors Need a Cash Flow Template
Electrical contractors face a cash flow structure that can look profitable on paper while creating real short-term pressure in the bank account. Commercial and new construction work pays on billing cycles — AIA applications for payment submitted monthly, with GC payment typically arriving 30–45 days later — but wire, conduit, panels, and labor costs run continuously from the day work starts. A $200,000 commercial project requires $60,000–$90,000 in materials and labor before the first draw request is even submitted, and 60–90 days before those first draw funds actually arrive. For a contractor running three commercial jobs simultaneously, that's a $180,000–$270,000 cash commitment against payments that are still weeks away.
The specific cash flow metrics that matter for electrical contractors are driven by job type mix. Revenue per man-hour is the core efficiency metric — residential service calls typically run $150–$250 per man-hour billed, while commercial work runs $80–$140 depending on the prevailing wage requirements and scope. Material markup percentage matters because materials are a large share of electrical revenue (often 30–45% of contract value) and the spread between your material cost and your billing rate is a direct contributor to gross margin. And days outstanding on commercial AR — the gap between when you submit a draw request and when the check arrives — is the single number most likely to create a cash crunch if it drifts from net 30 to net 60.
Electrical Industry at a Glance
Financial templates built for electrical contractors — from solo electricians to multi-crew commercial shops. Pre-loaded with labor, materials, and overhead categories specific to the electrical trades.
Revenue Drivers
- Residential service calls
- Commercial project contracts
- New construction installs
- Panel upgrades
- Maintenance & service agreements
- Material markups
Key Cost Categories
- Materials & wire
- Labor (journeymen & apprentices)
- Permits & inspection fees
- Vehicle & fuel
- Tools & equipment
- Insurance & bonding
- Subcontractors
- Overhead & office
Typical Margins
Gross: 35-50% · Net: 5-12%
Seasonality
Commercial construction peaks spring through fall. Residential service work is relatively steady year-round, with spikes in summer (AC-related) and fall (heating season). Slowest in January–February.
Key Performance Indicators
Electrical Cash Flow Template FAQ
More Electrical Templates
Electrical Contractor Balance Sheet Template for Excel
$29
Electrical Contractor Budget Template for Excel
$29
Electrical Contractor Business Plan Template for Excel
$39
Electrical Contractor Expense Tracker Template for Excel
$29
Electrical Contractor Financial Model Template for Excel
$29
Electrical Contractor Income Statement Template for Excel
$29
Electrical Invoice Template for Excel
$29
Electrical Contractor KPI Dashboard Template for Excel
$29
Electrical Contractor P&L Template for Excel
$29
Electrical Contractor Pro Forma Template for Excel
$29
Electrical Project Budget Template for Excel
$29
Electrical Contractor Sales Forecast Template for Excel
$29
Electrical Contractor Valuation Template for Excel
$29
Electrical Cash Flow Template
$29