Electrical Financial Model Template
A complete financial model for electrical contractors — project revenue by job type, track job costs and material margins, and see your P&L and cash flow in one connected workbook.
What's Inside This Electrical Contractor Financial Model
This template includes 7 worksheets, each designed for a specific part of your electrical financial workflow:
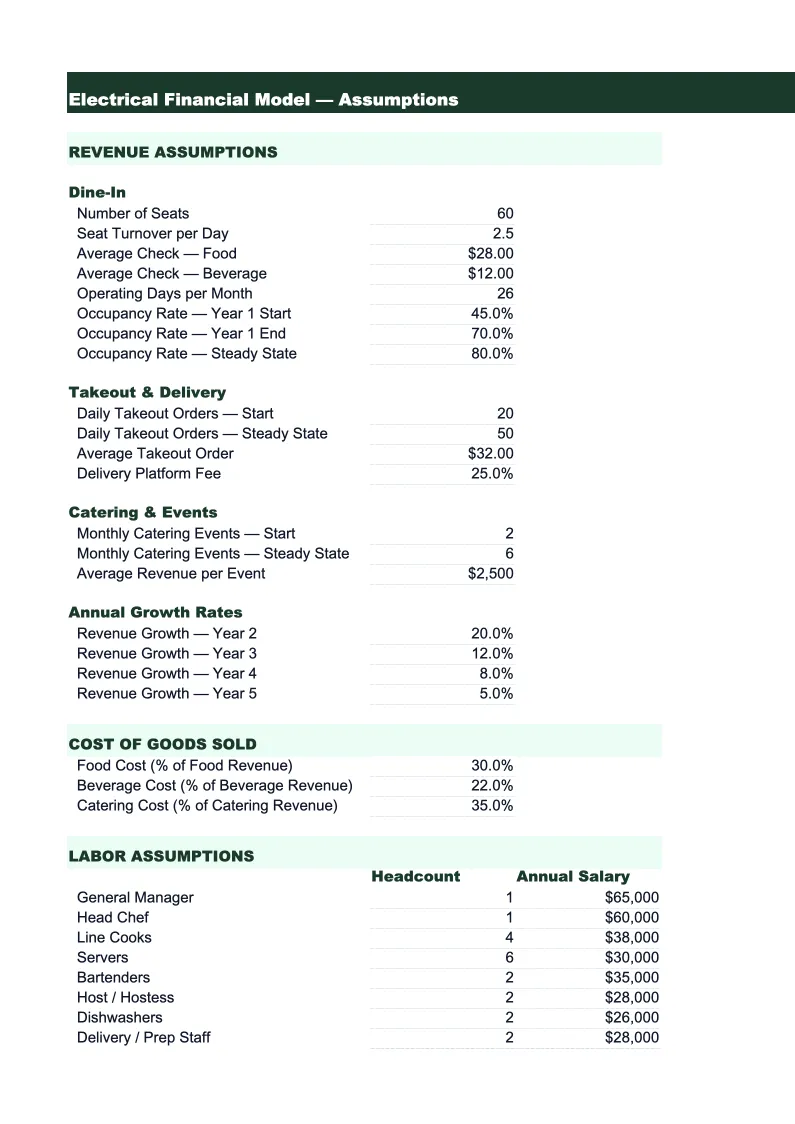
Assumptions
The control panel for the entire model.
Revenue Projections
A 12-month revenue forecast broken down by job category — residential service calls, commercial project work, new construction installs, panel upgrades, and maintenance and service agreements.
Job Costing
The heart of an electrical contractor's financial model.
P&L
A full 12-month income statement that pulls revenue from the Revenue Projections sheet and direct costs from the Job Costing sheet.
Cash Flow
A monthly cash flow projection that starts with net income and adjusts for the timing differences that matter most to contractors — accounts receivable (commercial jobs often pay in 30–60 days), accounts payable on materials, equipment purchases, and loan payments.
Balance Sheet
A projected balance sheet showing your business's financial position at the end of each quarter.
KPI Dashboard
A visual summary of the metrics that define a healthy electrical contracting business.
Electrical Financial Model Template Features
- Revenue projections by job type: service calls, commercial, new construction, and service agreements
- Job costing model with labor burden rate, material markup, and per-category gross margin
- 12-month P&L with electrical contractor operating expense categories
- Cash flow projection that accounts for 30–60 day commercial receivables
- KPI dashboard tracking revenue per man-hour, material markup, and backlog
- Scenario planning via centralized Assumptions sheet — add a crew or change markup with one input
How to Use This Electrical Contractor Financial Spreadsheet
Start with the Assumptions sheet — that's where you input your business's core operating parameters. Enter your number of crews, average weekly billable hours, blended labor rate, and material markup percentage. If you're not sure about some inputs, use last year's actual numbers as your baseline. These inputs flow automatically to every other sheet in the model, so getting the Assumptions right is the most important first step. Most electrical contractors can fill this out in about 20 minutes.
Once your assumptions are set, move to the Revenue Projections sheet and enter your expected job volume and average ticket by category for each month. Use your backlog and pipeline to populate the near-term months, and your historical averages for months further out. The Job Costing sheet will calculate your expected gross margin by category automatically. Review that sheet closely — it's often where contractors discover that one job type is quietly underperforming when the numbers are this explicit.
15 minutes from download to your first financial model
Download the template, plug in your crew size and job mix, and see your electrical contracting business's full financial picture — P&L, cash flow, and KPIs connected in one workbook.
Why Electrical Contractors Need a Financial Model
Most electrical contractors run the business off their bank balance — money in the account feels like profit, and a slow week feels like a crisis. The problem is that contractor cash flow doesn't match profitability. A large commercial job might represent $80,000 in earned revenue, but if the GC pays in 60 days, your bank account won't show it for two months. Meanwhile, you've paid your crew, bought materials, and fueled your trucks. A financial model makes this gap visible before it becomes a problem.
The two numbers that determine whether an electrical contracting business is actually healthy are revenue per man-hour and gross margin by job type. Revenue per man-hour — total billings divided by total crew hours — benchmarks your pricing and productivity together. Most established electrical contractors target $85–$115 per man-hour depending on their market and job mix. Gross margin by job type tells you whether residential service calls, commercial projects, and new construction are each contributing adequately to cover overhead. It's common to find that new construction work is priced too low because it was won on competitive bids without fully accounting for labor burden and overhead allocation.
Electrical Industry at a Glance
Financial templates built for electrical contractors — from solo electricians to multi-crew commercial shops. Pre-loaded with labor, materials, and overhead categories specific to the electrical trades.
Revenue Drivers
- Residential service calls
- Commercial project contracts
- New construction installs
- Panel upgrades
- Maintenance & service agreements
- Material markups
Key Cost Categories
- Materials & wire
- Labor (journeymen & apprentices)
- Permits & inspection fees
- Vehicle & fuel
- Tools & equipment
- Insurance & bonding
- Subcontractors
- Overhead & office
Typical Margins
Gross: 35-50% · Net: 5-12%
Seasonality
Commercial construction peaks spring through fall. Residential service work is relatively steady year-round, with spikes in summer (AC-related) and fall (heating season). Slowest in January–February.
Key Performance Indicators
Electrical Contractor Financial Model FAQ
More Electrical Templates
Electrical Contractor Balance Sheet Template for Excel
$29
Electrical Contractor Budget Template for Excel
$29
Electrical Contractor Business Plan Template for Excel
$39
Electrical Contractor Cash Flow Template for Excel
$29
Electrical Contractor Expense Tracker Template for Excel
$29
Electrical Contractor Income Statement Template for Excel
$29
Electrical Invoice Template for Excel
$29
Electrical Contractor KPI Dashboard Template for Excel
$29
Electrical Contractor P&L Template for Excel
$29
Electrical Contractor Pro Forma Template for Excel
$29
Electrical Project Budget Template for Excel
$29
Electrical Contractor Sales Forecast Template for Excel
$29
Electrical Contractor Valuation Template for Excel
$29
More Financial Model Templates
Electrical Financial Model Template
$29