Electrical Sales Forecast Template
Forecast your electrical contracting revenue from service call volume, commercial project backlog, and bid pipeline — with monthly projections by job type, scenario planning, and actual vs forecast tracking.
What's Inside This Electrical Contractor Sales Forecast Template
This template includes 7 worksheets, each designed for a specific part of your electrical financial workflow:
Job Pipeline
The central intake sheet for all active bids and prospects.
Backlog Schedule
A month-by-month revenue schedule for all contracted and scheduled work.
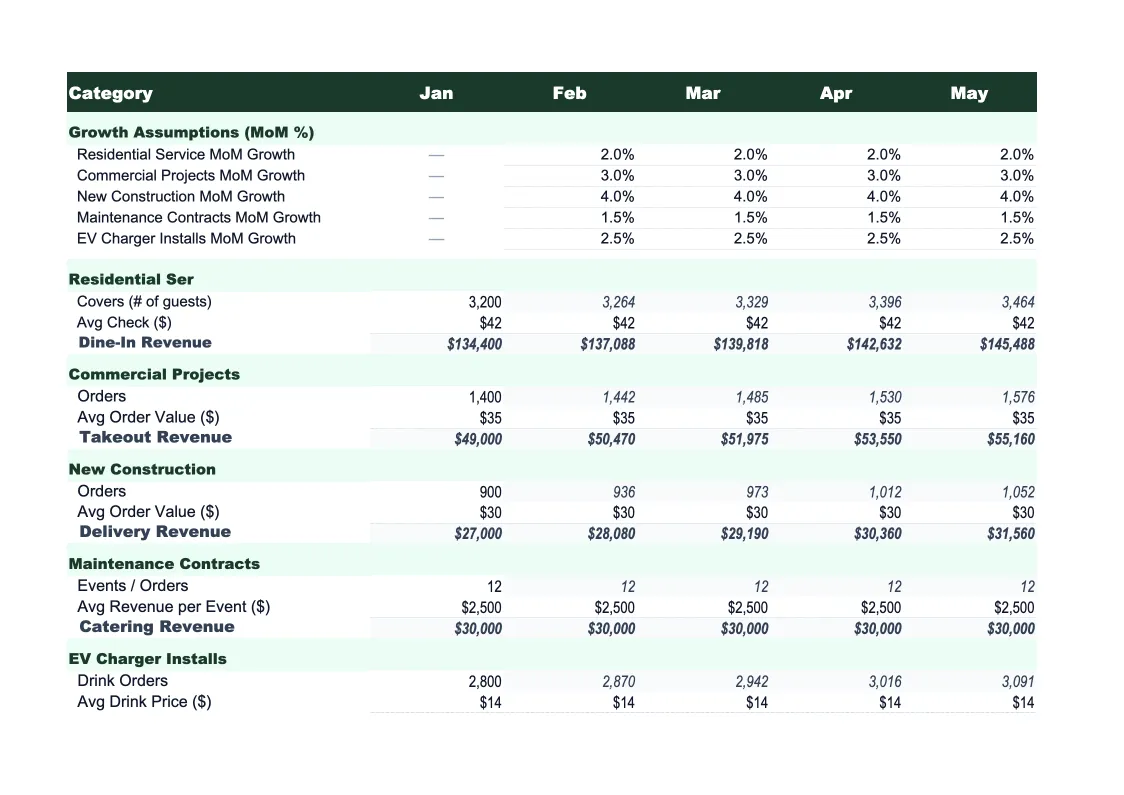
Monthly Forecast
The full 12-month revenue projection, combining three sources: backlog schedule revenue pulled automatically from the Backlog Schedule sheet, weighted pipeline revenue based on estimated monthly conversions from the Job Pipeline sheet, and service call volume estimates entered as monthly assumptions.
Annual Summary
A full-year rollup showing total projected revenue by job type for the entire forecast period, with month-by-month columns and an annual total on the right.
Actual vs Forecast
Enter your actual monthly billings alongside projections and the sheet calculates dollar and percentage variance for each month and each job type.
Scenario Comparison
Three side-by-side revenue scenarios — base case, upside, and downside — built from different pipeline win rates, service call volume assumptions, and backlog timing.
Dashboard
A visual summary of your forecast with pre-built charts: monthly projected revenue by job type (stacked bar), backlog vs pipeline coverage trend (line chart), actual vs forecast variance over the trailing six months, and revenue per man-hour trend.
Electrical Sales Forecast Template Features
- Weighted job pipeline: bid value × close probability per project
- Backlog revenue schedule spread across project and installation timelines
- Revenue split by job type (residential service, commercial, installation, service agreements)
- Three-scenario comparison with adjustable win rates and project delay assumptions
- Actual vs forecast tracker with variance analysis and rolling accuracy score
- Visual dashboard with backlog coverage ratio and revenue-per-man-hour tracking
How to Use This Electrical Contractor Sales Forecast Spreadsheet
Start with the two foundation sheets before building out the forecast. First, populate the Backlog Schedule with every job that's already contracted or scheduled — enter the job name, total contract value, start month, and estimated duration. For recurring service agreements, enter the monthly revenue value directly. This is your committed revenue base and the most reliable part of the model. Then move to the Job Pipeline sheet and enter your active bids with estimated contract values and honest close probabilities. A reasonable starting point for probabilities: quotes submitted and awaiting response are 25–35%, jobs where you've been shortlisted are 55–65%, and verbal awards awaiting signed contracts are 85–90%. Plan 30–45 minutes for the initial setup if you pull your active bid log before sitting down.
Once the pipeline and backlog are in, review the Monthly Forecast sheet to check whether the projections look realistic. Electrical revenue is uneven by nature — commercial project starts create large monthly spikes, residential service call volume fluctuates seasonally, and permit timelines can push project starts by weeks. Adjust the service call volume assumptions for months where your area historically slows (winter in cold climates, summer doldrums for commercial work) or spikes (summer AC season for residential service). Fill in the Scenario Comparison sheet early: set a downside where your commercial bid win rate drops 20% and three projects slip by a quarter, then check whether that downside still covers your field crew payroll and fixed overhead. If it does, your pipeline is healthy.
15 minutes from download to your first revenue forecast
Download the template, enter your backlog and active bids, and see your electrical contracting company's projected revenue — month by month, job type by job type.
Why Every Electrical Contractor Needs a Sales Forecast Template
Revenue forecasting for electrical contractors is harder than it looks because the business runs on two fundamentally different revenue models at the same time. Service call and residential work generates revenue in days — a customer calls, you dispatch, you invoice the same week. Commercial project work generates revenue in months — you bid in January, sign the contract in March, break ground in May, and bill on progress milestones through November. Most electrical contractors manage these two streams by feel, which works fine when times are good and creates real cash flow problems when commercial projects get delayed or service call volume drops in a slow season. A structured forecast doesn't eliminate that variability, but it makes it visible weeks earlier than your accounting software will.
Two metrics define the revenue health of an electrical contracting business. Backlog coverage ratio is your total contracted work divided by your annual revenue target — most stable electrical contractors carry three to six months of backlog, with commercial-heavy shops carrying more and service-heavy shops carrying less. Below two months means you're dependent on pipeline wins and service call volume to hit your year. Bid-to-win rate is how often you close the bids you submit — most electrical contractors win 25–40% of commercial bids and 50–65% of residential proposals, depending on how selective they are about what they bid. If you're weighting bids at 40% probability but only winning 20%, your forecast will overstate revenue by twice the difference. Tracking both metrics monthly, which this template does automatically, is what separates contractors who manage their pipeline from those who react to it.
Electrical Industry at a Glance
Financial templates built for electrical contractors — from solo electricians to multi-crew commercial shops. Pre-loaded with labor, materials, and overhead categories specific to the electrical trades.
Revenue Drivers
- Residential service calls
- Commercial project contracts
- New construction installs
- Panel upgrades
- Maintenance & service agreements
- Material markups
Key Cost Categories
- Materials & wire
- Labor (journeymen & apprentices)
- Permits & inspection fees
- Vehicle & fuel
- Tools & equipment
- Insurance & bonding
- Subcontractors
- Overhead & office
Typical Margins
Gross: 35-50% · Net: 5-12%
Seasonality
Commercial construction peaks spring through fall. Residential service work is relatively steady year-round, with spikes in summer (AC-related) and fall (heating season). Slowest in January–February.
Key Performance Indicators
Electrical Contractor Sales Forecast Template FAQ
More Electrical Templates
Electrical Contractor Balance Sheet Template for Excel
$29
Electrical Contractor Budget Template for Excel
$29
Electrical Contractor Business Plan Template for Excel
$39
Electrical Contractor Cash Flow Template for Excel
$29
Electrical Contractor Expense Tracker Template for Excel
$29
Electrical Contractor Financial Model Template for Excel
$29
Electrical Contractor Income Statement Template for Excel
$29
Electrical Invoice Template for Excel
$29
Electrical Contractor KPI Dashboard Template for Excel
$29
Electrical Contractor P&L Template for Excel
$29
Electrical Contractor Pro Forma Template for Excel
$29
Electrical Project Budget Template for Excel
$29
Electrical Contractor Valuation Template for Excel
$29
More Sales Forecast Templates
Electrical Sales Forecast Template
$29