Electrical KPI Dashboard Template
Track revenue per man-hour, job cost variance, bid-to-win ratio, backlog in weeks, and the other metrics that separate profitable electrical contractors from busy ones.
What's Inside This Electrical Contractor KPI Dashboard Template
This template includes 6 worksheets, each designed for a specific part of your electrical financial workflow:
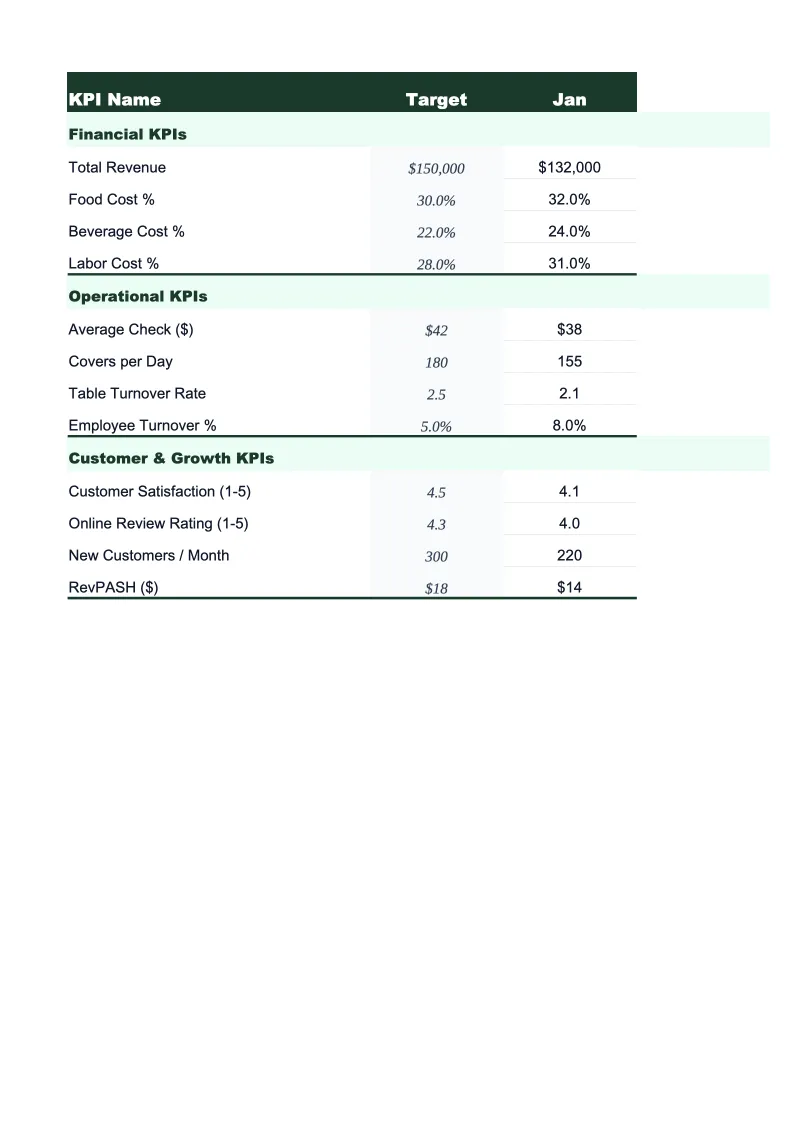
KPI Dashboard
The main visual overview of your electrical contracting business's performance at a glance.
Job Performance Tracker
A structured log for tracking each job or work order from estimate to close.
Monthly Scorecard
Set targets for each KPI at the start of the month, then enter actuals as work closes out.
Crew Utilization
A per-crew or per-technician breakdown of billable hours, total hours, utilization rate, and revenue generated by week and by month.
Pipeline & Backlog
A rolling view of your sales pipeline and work backlog.
12-Month Trends
A rolling 12-month view of your most important KPIs plotted as line charts.
Electrical Contractor KPI Dashboard Features
- 22 pre-loaded electrical contractor KPIs including revenue per man-hour, job cost variance, and bid-to-win ratio
- Color-coded status indicators — green/yellow/red against your set monthly targets
- Job-level cost tracker with estimated vs. actual labor and material variance calculations
- Per-crew utilization and billable hours tracker with weekly and monthly views
- Pipeline and backlog tracker with bid-to-win ratio by project type
- 12-month trend charts for revenue per man-hour, margins, and backlog
How to Use This Electrical Contractor KPI Spreadsheet
Start with the Monthly Scorecard tab and enter your targets for the month. If you don't have formal targets yet, use the benchmark ranges pre-loaded in the template — revenue per man-hour targets, utilization percentages, and margin ranges are drawn from industry data so you have a real baseline from day one. Setting targets takes about 15 minutes, and you only need to revisit them when your labor rate, crew size, or job mix changes significantly.
Log jobs in the Job Performance Tracker as they close — not all at once at month-end. Enter estimated and actual hours and materials for each completed job; the formulas calculate variance and margin automatically. Update the Crew Utilization sheet weekly with each crew member's billable and scheduled hours. Keep the Pipeline & Backlog tab current as bids go out and results come in — the backlog calculation only works if active bids and won contracts are entered consistently.
15 minutes from download to your first KPI review
Download the template, enter your targets, and start tracking the metrics that actually determine whether your electrical business is profitable.
Why Every Electrical Contractor Needs a KPI Dashboard
Electrical contractors run on margins that look reasonable on paper — 35–50% gross margin — until job cost overruns and unrecovered overhead eat into them. With net margins of 5–12%, the difference between a profitable year and a losing one often comes down to a few percentage points on labor efficiency and estimating accuracy. Most contractors don't know which job types consistently run over estimate until they've lost the money on dozens of them. A KPI dashboard doesn't prevent overruns, but it makes the pattern visible fast enough to fix the estimate rather than repeat the loss.
The KPIs that matter most in electrical contracting fall into three groups. Field performance metrics: revenue per man-hour (target varies by market but typically $65–$120 for journeymen labor), billable utilization rate (target 75–85% for field crews), and job cost variance (how closely actual costs match estimates). Pipeline metrics: bid-to-win ratio (typical range 25–40% for commercial work, higher for residential service), average job size, and backlog in weeks. Profitability metrics: material markup percentage (typically 20–35% over cost), overhead recovery rate, gross margin, and net margin. Tracking these metrics together reveals whether the business's problems are in the field, in estimating, or in the office.
Electrical Industry at a Glance
Financial templates built for electrical contractors — from solo electricians to multi-crew commercial shops. Pre-loaded with labor, materials, and overhead categories specific to the electrical trades.
Revenue Drivers
- Residential service calls
- Commercial project contracts
- New construction installs
- Panel upgrades
- Maintenance & service agreements
- Material markups
Key Cost Categories
- Materials & wire
- Labor (journeymen & apprentices)
- Permits & inspection fees
- Vehicle & fuel
- Tools & equipment
- Insurance & bonding
- Subcontractors
- Overhead & office
Typical Margins
Gross: 35-50% · Net: 5-12%
Seasonality
Commercial construction peaks spring through fall. Residential service work is relatively steady year-round, with spikes in summer (AC-related) and fall (heating season). Slowest in January–February.
Key Performance Indicators
Electrical Contractor KPI Dashboard FAQ
More Electrical Templates
Electrical Contractor Balance Sheet Template for Excel
$29
Electrical Contractor Budget Template for Excel
$29
Electrical Contractor Business Plan Template for Excel
$39
Electrical Contractor Cash Flow Template for Excel
$29
Electrical Contractor Expense Tracker Template for Excel
$29
Electrical Contractor Financial Model Template for Excel
$29
Electrical Contractor Income Statement Template for Excel
$29
Electrical Invoice Template for Excel
$29
Electrical Contractor P&L Template for Excel
$29
Electrical Contractor Pro Forma Template for Excel
$29
Electrical Project Budget Template for Excel
$29
Electrical Contractor Sales Forecast Template for Excel
$29
Electrical Contractor Valuation Template for Excel
$29
More KPI Dashboard Templates
Electrical KPI Dashboard Template
$29