Real Estate P&L Template
Track your real estate business's gross commission income, property management fees, and expenses with a P&L built for agents, brokers, and property managers — not a generic spreadsheet you have to rewire from scratch.
What's Inside This Real Estate P&L Template
This template includes 4 worksheets, each designed for a specific part of your real estate financial workflow:
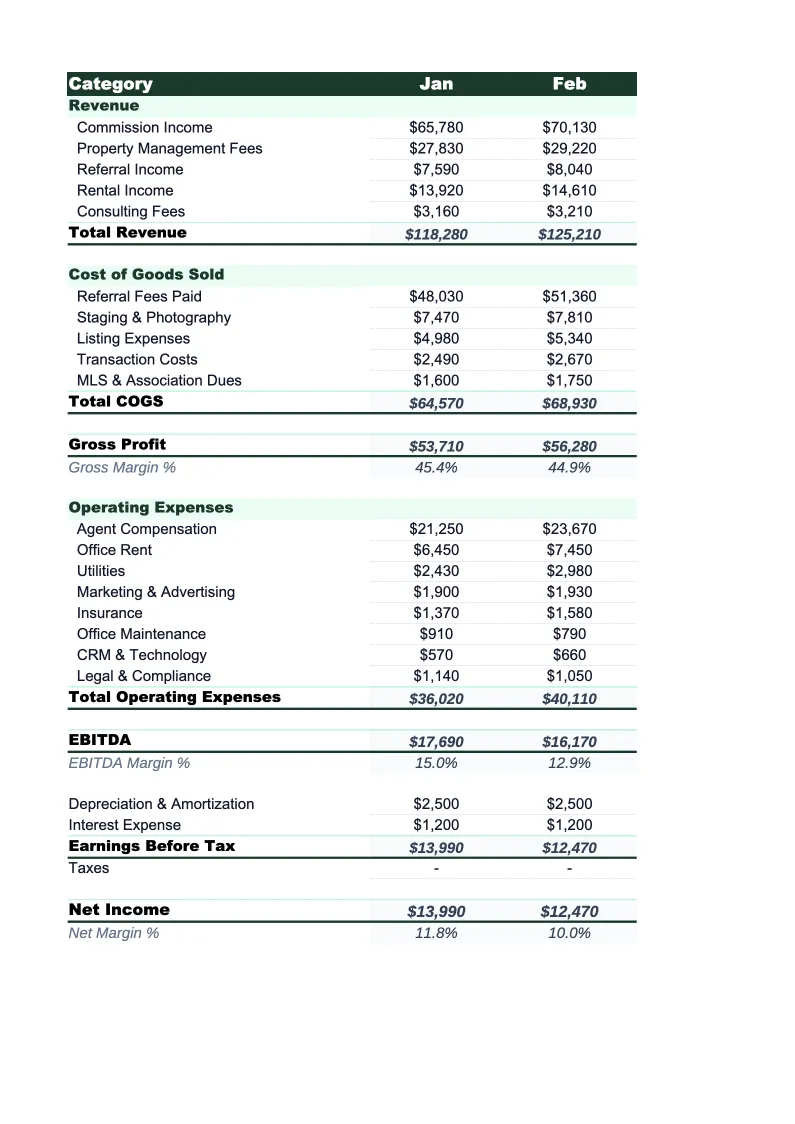
Monthly P&L
The core worksheet where you record each month's revenue and expenses.
Annual P&L
A 12-month view that pulls automatically from the Monthly P&L sheet.
Commission Tracker
A deal-by-deal log for tracking individual transactions and their commission income.
Dashboard
A one-page visual summary with pre-built charts and key performance metrics.
Real Estate P&L Template Features
- Revenue split by source: buy-side commissions, sell-side commissions, property management, and referrals
- Commission Tracker with deal-level transaction log and split calculations
- MLS, E&O, brokerage fee, and technology expense categories pre-loaded
- Gross income and net income auto-calculated every month
- 12-month annual P&L view with full-year totals
- Visual dashboard with GCI trend, revenue mix, and margin charts
How to Use This Real Estate P&L Spreadsheet
Download the .xlsx file and open it in Excel or Google Sheets — no macros, no plugins required. Start on the Monthly P&L sheet and review the pre-loaded revenue and expense categories. Most agents and property managers can go live with the categories as-is; just rename or remove the lines that don't apply to your business model (for example, if you don't manage properties, remove the property management revenue section and replace it with another income stream). First-time setup typically takes 15–20 minutes.
Once your categories are set, enter your revenue and expense figures for the current month. For commissions, pull your HUD-1 settlement statements or brokerage commission disbursements. For expenses, your bank statements or accounting software will have what you need. The Commission Tracker sheet is worth maintaining in parallel: log each closed deal with its sale price and commission rate, and the sheet will cross-reference with your monthly totals to make sure everything reconciles.
15 minutes from download to your first P&L
Download the template, enter last month's commissions and expenses, and see your real estate business's gross income, net income, and expense breakdown — with deal-level commission tracking included.
Why Every Real Estate Agent Needs a P&L Template
Real estate agents and small brokerages have an unusual financial profile: revenue is highly variable, tied to the volume and size of closed transactions, while many expenses are fixed regardless of how many deals close in a given month. MLS dues, E&O insurance, CRM subscriptions, and brokerage fees don't stop when the market slows. Without a P&L, it's easy to feel profitable during a hot spring market and then run out of runway during a slow Q4 — because the income spike was real but didn't account for the fixed cost base underneath it.
A proper real estate P&L separates commission income from recurring income — two streams that behave completely differently. Commission income is lumpy and seasonal, peaking March through August and slowing sharply in December and January. Property management fees are predictable monthly recurring revenue that offset the seasonal swings. When your P&L shows these separately, you can see what percentage of your income is stable and what percentage is transaction-dependent — and whether you need more managed units, more listings, or better deal flow to hit your annual income targets. Net margins for real estate professionals typically range from 15–35%, but that number is meaningless without knowing what's driving it.
Real Estate Industry at a Glance
Financial templates built for real estate professionals — agents, brokers, property managers, appraisers, and inspectors. Pre-loaded with commission tracking, management fee structures, and transaction-based billing.
Revenue Drivers
- Sales commissions
- Property management fees
- Lease-up / tenant placement fees
- Appraisal & inspection fees
Key Cost Categories
- MLS & licensing fees
- Marketing & advertising
- E&O insurance
- Transaction coordination
- Technology & CRM
- Office & brokerage fees
Typical Margins
Gross: 40-70% · Net: 15-35%
Seasonality
Peak activity spring through summer (March–August); winter slowdown, especially December–January. Commercial real estate has less pronounced seasonality.
Key Performance Indicators
Real Estate P&L Template FAQ
More Real Estate Templates
Real Estate Balance Sheet Template for Excel
$29
Real Estate Budget Template for Excel
$29
Real Estate Business Plan Template for Excel
$39
Real Estate Cash Flow Template for Excel
$29
Real Estate Expense Tracker Template for Excel
$29
Real Estate Financial Model Template for Excel
$29
Real Estate Income Statement Template for Excel
$29
Real Estate Invoice Template for Excel
$29
Real Estate KPI Dashboard Template for Excel
$29
Real Estate Pro Forma Template for Excel
$29
Real Estate Project Budget Template for Excel
$29
Real Estate Sales Forecast Template for Excel
$29
Real Estate Business Valuation Template for Excel
$29
Real Estate P&L Template
$29