Real Estate KPI Dashboard Template
Track gross commission income, transaction volume, pipeline health, and key performance metrics in one dashboard built for real estate agents, brokers, and property managers.
What's Inside This Real Estate KPI Dashboard Template
This template includes 5 worksheets, each designed for a specific part of your real estate financial workflow:
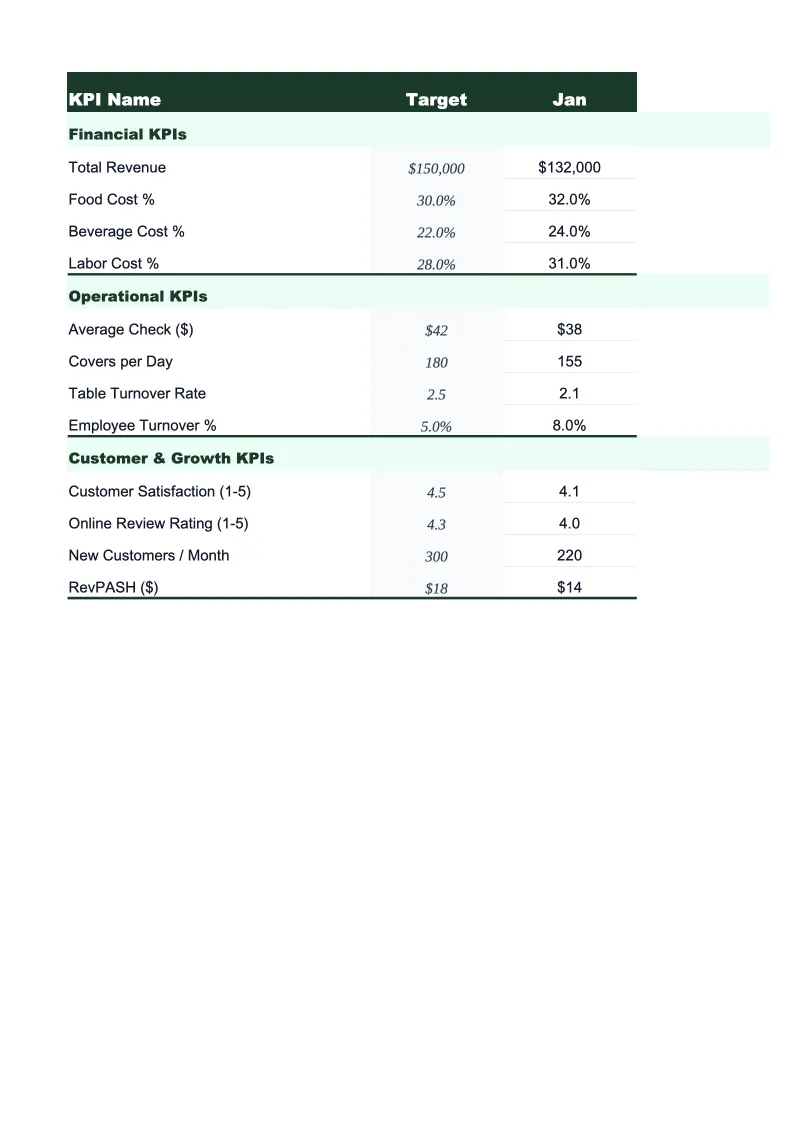
KPI Dashboard
The main dashboard showing all critical real estate performance metrics in one view.
Transaction Log
A running log of every transaction with columns for client name, property address, list price, sale price, close date, commission rate, and gross commission earned.
Pipeline Tracker
Track every active deal from initial contact through closing.
Monthly Trends
A 12-month view of your key metrics plotted over time so you can spot patterns in your business.
Lead Source Analysis
Break down your transactions by lead source — referrals, past clients, sphere of influence, online leads, open houses, social media, and any custom sources you add — to understand where your best business comes from.
Real Estate KPI Dashboard Template Features
- GCI tracking with year-to-date, monthly, and year-over-year comparisons
- Transaction log with auto-calculated commissions and sale-to-list ratio
- Pipeline tracker showing projected income by deal stage
- Lead source analysis by transaction count and GCI produced
- Days on market and average sale price trend charts
- Monthly trend view across 12 months with auto-updating charts
How to Use This Real Estate KPI Spreadsheet
Getting started takes about 20 minutes. Download the .xlsx file and open it in Excel or Google Sheets. Begin with the Transaction Log: enter your closed transactions from the current year, including property address, sale price, commission rate, and close date. The sheet calculates your commission automatically and feeds the GCI totals into the dashboard. If you're partway through the year, entering your year-to-date transactions gives you an accurate starting point for all the dashboard metrics.
Once the Transaction Log has your historical data, move to the Pipeline Tracker and add every deal currently in progress. Assign each one a stage, an estimated close date, and an expected commission. This gives the pipeline summary an accurate picture of your projected income for the next 30, 60, and 90 days — useful for managing personal cash flow, since commission income rarely lands on a predictable schedule. Update the pipeline weekly as deals move through stages or fall out.
20 minutes from download to your first KPI snapshot
Download the template, enter your transactions, and see your real estate business's full performance picture — GCI trends, pipeline health, and lead source ROI included.
Why Real Estate Agents and Brokers Need a KPI Dashboard
Real estate income is lumpy by nature — multiple closings in one month, nothing the next — which makes it easy to feel busy without actually growing your business. Gross commission income is the only metric that matters for an agent's livelihood, but GCI alone doesn't tell you why it's up or down or what levers you have to pull. Transaction volume, average days on market, pipeline depth, and lead source efficiency all feed into your GCI, and tracking them consistently is what separates agents who grow predictably from those who ride the market up and down.
A real estate KPI dashboard should center on three time horizons: what closed last month (transaction log and GCI actuals), what's closing in the next 60 days (pipeline tracker), and whether your business is trending in the right direction over 12 months (monthly trends). Days on market is one of the most actionable operational metrics — if your listings are sitting longer than the local average, it's a pricing, presentation, or marketing problem you can fix. Conversion rate from lead to close tells you whether your lead generation is producing real business or just contact volume. Average sale-to-list ratio tells you how well your pricing strategy is holding up in negotiation.
Real Estate Industry at a Glance
Financial templates built for real estate professionals — agents, brokers, property managers, appraisers, and inspectors. Pre-loaded with commission tracking, management fee structures, and transaction-based billing.
Revenue Drivers
- Sales commissions
- Property management fees
- Lease-up / tenant placement fees
- Appraisal & inspection fees
Key Cost Categories
- MLS & licensing fees
- Marketing & advertising
- E&O insurance
- Transaction coordination
- Technology & CRM
- Office & brokerage fees
Typical Margins
Gross: 40-70% · Net: 15-35%
Seasonality
Peak activity spring through summer (March–August); winter slowdown, especially December–January. Commercial real estate has less pronounced seasonality.
Key Performance Indicators
Real Estate KPI Dashboard Template FAQ
More Real Estate Templates
Real Estate Balance Sheet Template for Excel
$29
Real Estate Budget Template for Excel
$29
Real Estate Business Plan Template for Excel
$39
Real Estate Cash Flow Template for Excel
$29
Real Estate Expense Tracker Template for Excel
$29
Real Estate Financial Model Template for Excel
$29
Real Estate Income Statement Template for Excel
$29
Real Estate Invoice Template for Excel
$29
Real Estate P&L Template for Excel
$29
Real Estate Pro Forma Template for Excel
$29
Real Estate Project Budget Template for Excel
$29
Real Estate Sales Forecast Template for Excel
$29
Real Estate Business Valuation Template for Excel
$29
More KPI Dashboard Templates
Real Estate KPI Dashboard Template
$29