Real Estate Sales Forecast Template
Forecast your gross commission income by transaction type, average sales price, and monthly close volume — with a pipeline tracker and scenario planning built in.
What's Inside This Real Estate Sales Forecast Template
This template includes 6 worksheets, each designed for a specific part of your real estate financial workflow:
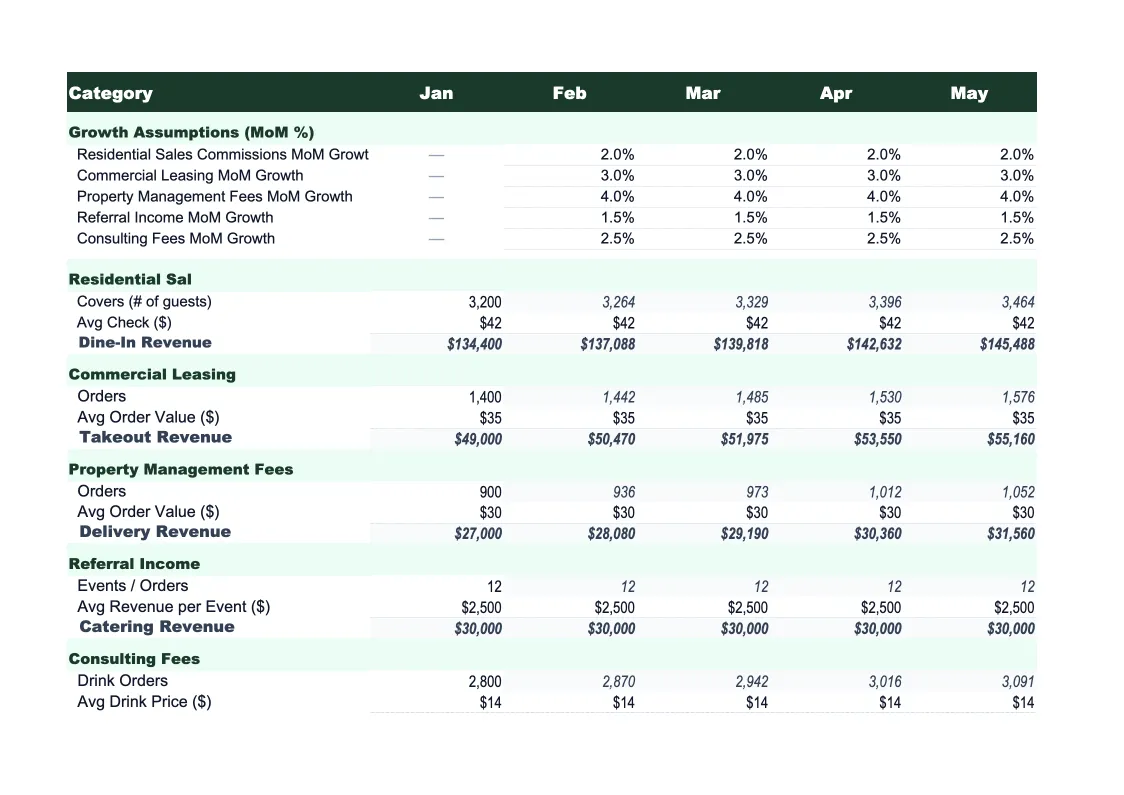
Revenue Assumptions
The driver sheet where you set the inputs that power the entire forecast.
Monthly Forecast
A full 12-month projection of gross commission income built from your Revenue Assumptions inputs.
Pipeline Tracker
A live deal tracker for active listings and buyer clients that feeds probability-weighted revenue into the Monthly Forecast.
Forecast vs Actual
Track your real closed commissions against your monthly projections to see where your forecast is holding up and where it's drifting.
Scenarios
Three pre-built scenarios — Base, Upside, and Downside — for planning through different market conditions.
Annual Summary
A one-page summary of your full-year forecast showing total projected GCI, deal count by transaction type, average commission per deal, and month-by-month revenue in a chart.
Real Estate Sales Forecast Template Features
- GCI forecast by transaction type — residential buyer, seller, commercial, rentals
- Probability-weighted pipeline tracker for active listings and buyer clients
- Three-scenario planning: base, upside, and downside deal volume
- Monthly forecast vs actual variance tracking with color flags
- Average sales price and commission rate assumptions by deal category
- 12-month annual summary chart with seasonal pattern visualization
How to Use This Real Estate Sales Forecast Spreadsheet
Start with the Revenue Assumptions sheet. Enter your expected monthly deal count for each transaction type — residential buyer deals, seller listings, commercial, and any rental placements. Set an average sales price per category based on your market and your typical price point, then enter your commission rate. If you have referral splits, you can account for those here too. This takes about 15 minutes and once it's done, the rest of the workbook populates automatically.
Move to the Pipeline Tracker and log your current active deals. For each one, enter the client name, expected close month, projected sales price, and your close probability. The sheet handles the probability weighting — a $500,000 listing at 50% probability contributes $7,500 in expected commission to your forecast, not the full $15,000. Keep this updated weekly as deals progress or fall out, and your Monthly Forecast will stay accurate without any manual adjustments.
15 minutes from download to your first GCI forecast
Download the template, enter your deal types and average sales price, and see your projected commission income for every month of the year.
Why Real Estate Agents and Teams Need a Sales Forecast
Real estate income is lumpier than almost any other industry. A single month can swing from your worst to your best of the year depending on which deals are scheduled to close. Without a forecast built around your actual pipeline and deal conversion rates, it's nearly impossible to make confident decisions about marketing budgets, support staff, or personal draws. Most agents know their annual GCI goal but don't have a month-by-month plan — which means every slow month feels like a crisis instead of a predictable seasonal dip.
A good real estate sales forecast is built on three numbers: projected deal count, average sales price, and commission rate by deal type. Residential buyer deals and seller listings often have different commission rates, different close timelines, and different seasonal patterns. Commercial deals tend to be larger but less frequent. Rental placements are smaller but more predictable. Breaking these out separately gives you a much more accurate revenue picture than averaging everything together — and it tells you which deal type to prioritize when you want to grow.
Real Estate Industry at a Glance
Financial templates built for real estate professionals — agents, brokers, property managers, appraisers, and inspectors. Pre-loaded with commission tracking, management fee structures, and transaction-based billing.
Revenue Drivers
- Sales commissions
- Property management fees
- Lease-up / tenant placement fees
- Appraisal & inspection fees
Key Cost Categories
- MLS & licensing fees
- Marketing & advertising
- E&O insurance
- Transaction coordination
- Technology & CRM
- Office & brokerage fees
Typical Margins
Gross: 40-70% · Net: 15-35%
Seasonality
Peak activity spring through summer (March–August); winter slowdown, especially December–January. Commercial real estate has less pronounced seasonality.
Key Performance Indicators
Real Estate Sales Forecast Template FAQ
More Real Estate Templates
Real Estate Balance Sheet Template for Excel
$29
Real Estate Budget Template for Excel
$29
Real Estate Business Plan Template for Excel
$39
Real Estate Cash Flow Template for Excel
$29
Real Estate Expense Tracker Template for Excel
$29
Real Estate Financial Model Template for Excel
$29
Real Estate Income Statement Template for Excel
$29
Real Estate Invoice Template for Excel
$29
Real Estate KPI Dashboard Template for Excel
$29
Real Estate P&L Template for Excel
$29
Real Estate Pro Forma Template for Excel
$29
Real Estate Project Budget Template for Excel
$29
Real Estate Business Valuation Template for Excel
$29
More Sales Forecast Templates
Real Estate Sales Forecast Template
$29