SaaS P&L Template
Track your SaaS company's profitability with a P&L template built around MRR, ARR, and subscription revenue — not a generic business template patched together.
What's Inside This SaaS P&L Template
This template includes 5 worksheets, each designed for a specific part of your saas financial workflow:
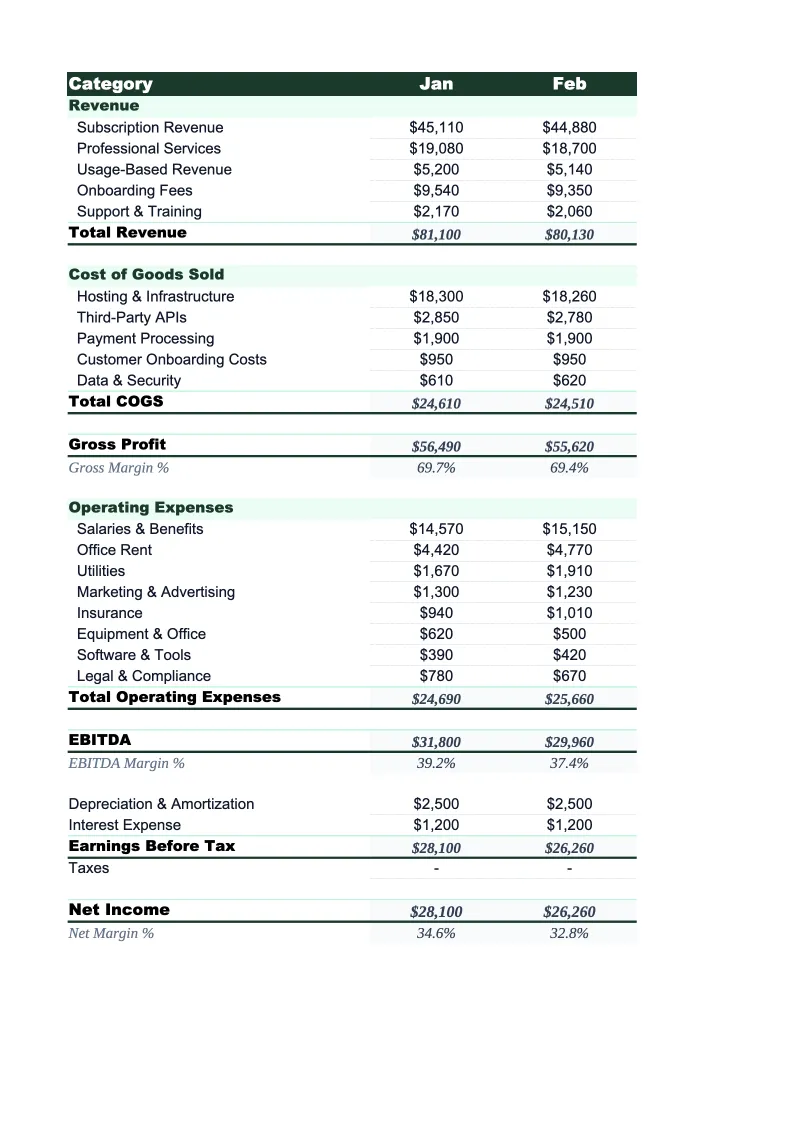
Monthly P&L
The core income statement, structured around how SaaS revenue actually works.
ARR Waterfall
Tracks the month-over-month movement of your annual recurring revenue using the standard SaaS waterfall model.
Department Expenses
A detailed breakdown of operating expenses organized by function, with sub-categories for each department.
Annual Summary
A 12-month rollup that pulls from each monthly sheet automatically, showing full-year revenue, COGS, gross profit, operating expenses by department, and net income.
Dashboard
A one-page visual summary with pre-built charts and KPI tiles covering the metrics SaaS investors and operators care about most.
SaaS P&L Template Features
- MRR-based revenue split: recurring, expansion, and one-time fees
- ARR waterfall tracking new, expansion, contraction, and churn
- Department expense breakdown: R&D, Sales & Marketing, and G&A
- Gross margin percentage auto-calculation with industry benchmarks
- Rule of 40 calculator on the dashboard
- 12-month annual summary for investor and board reporting
How to Use This SaaS P&L Spreadsheet
Start by setting up the ARR Waterfall sheet with your current MRR or ARR and the prior few months of movement if you have them. This seeds the revenue rows in the Monthly P&L automatically. Then open the Department Expenses sheet and review the pre-loaded sub-categories — adjust them to match your actual cost structure. Most early-stage SaaS companies will keep 70–80% of the rows as-is and rename or add a few lines specific to their stack or team setup. The whole setup takes about 20 minutes if you have a recent bank statement or accounting export handy.
Each month, enter your actual figures in three places: new and churned ARR in the waterfall, actual department expenses in the expense sheet, and any one-time or professional services revenue directly in the Monthly P&L. The gross profit calculation, operating expense totals, and all dashboard metrics update automatically. If you're using this for forward planning rather than actuals, enter your projected numbers the same way — the template works for budgets, forecasts, and actuals without any changes to the structure.
15 minutes from download to your first SaaS P&L
Download the template, plug in your MRR and expense data, and get a clean P&L with ARR waterfall, gross margin, and Rule of 40 — ready to share with your board.
Why Every SaaS Company Needs a P&L Template
SaaS businesses have a fundamentally different financial structure than other industries, and a generic P&L misses most of it. Revenue isn't transactional — it builds or decays month over month depending on new sales, expansion, contraction, and churn. Gross margins in the 60–80% range are normal and expected, but the path to profitability runs through operating leverage: how much of each new dollar of ARR flows through to operating income as you scale. Without a P&L designed for this model, it's easy to show revenue growth while quietly deteriorating on the margins that matter.
The key distinction in a SaaS P&L is how you structure the three layers: recurring revenue vs. one-time revenue, COGS vs. operating expenses, and then operating expenses broken out by functional area. COGS for SaaS includes infrastructure, customer success, and payment processing — costs that scale roughly with revenue. Operating expenses — R&D, Sales & Marketing, G&A — are the investment layer that should eventually produce leverage as the business scales. Investors evaluate SaaS companies on gross margin (is the core product profitable?), CAC payback period (how fast does new ARR pay back its acquisition cost?), and the Rule of 40 (is growth rate plus profit margin above 40?).
SaaS Industry at a Glance
Financial templates built for software-as-a-service businesses managing subscription billing, ARR growth, and recurring revenue operations.
Revenue Drivers
- monthly recurring revenue (MRR)
- annual contract value (ACV)
- seat-based or usage-based billing
- professional services and onboarding fees
- add-ons and tier upgrades
Key Cost Categories
- cloud infrastructure (AWS, GCP, Azure)
- employee salaries and benefits (engineering, sales, CS, marketing)
- customer acquisition (ads, events, SDR costs)
- SaaS tools and subscriptions
- payment processing fees
- R&D and product development
Typical Margins
Gross: 60-80% · Net: -5% to 20% depending on growth stage
Seasonality
Relatively flat month-to-month with Q4 spikes from enterprise budget cycles. Annual contract renewals cluster in January and July.
Key Performance Indicators
SaaS P&L Template FAQ
More SaaS Templates
SaaS Balance Sheet Template for Excel
$29
SaaS Budget Template for Excel
$29
SaaS Business Plan Template for Excel
$39
SaaS Cash Flow Template for Excel
$29
SaaS Expense Tracker Template for Excel
$29
SaaS Financial Model Template for Excel
$29
SaaS Income Statement Template for Excel
$29
SaaS Invoice Template for Excel
$29
SaaS KPI Dashboard Template for Excel
$29
SaaS Pro Forma Template for Excel
$29
SaaS Project Budget Template for Excel
$29
SaaS Sales Forecast Template for Excel
$29
SaaS Valuation Template for Excel
$29
SaaS P&L Template
$29