SaaS Pro Forma Template
Project a SaaS company's MRR and ARR growth, net revenue retention, customer acquisition costs, gross margin, and 5-year operating plan — with pre-built formulas for churn, expansion revenue, LTV:CAC ratio, CAC payback period, and the Rule of 40.
What's Inside This SaaS Pro Forma Template
This template includes 7 worksheets, each designed for a specific part of your saas financial workflow:
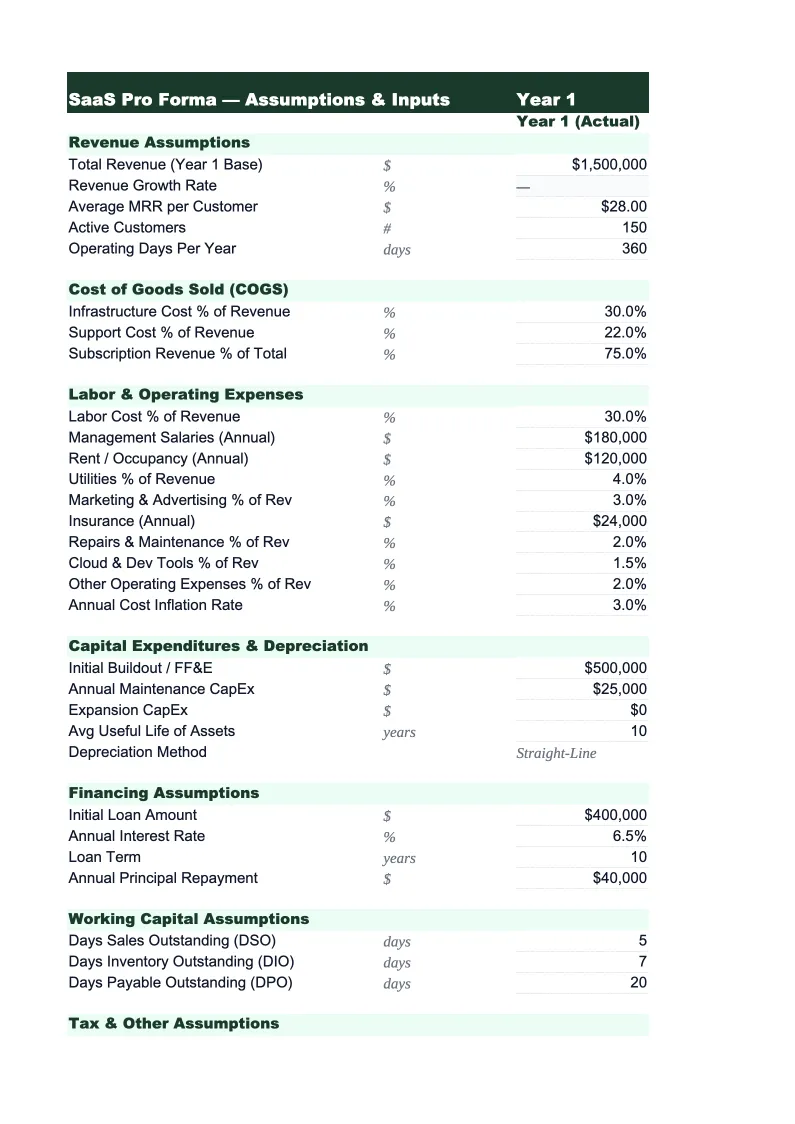
Assumptions
The central input panel that drives every downstream sheet.
MRR & ARR Build
The core revenue model, structured around the SaaS revenue waterfall: beginning MRR, plus new MRR from new logo wins, plus expansion MRR from seat additions and tier upgrades in existing accounts, minus contraction MRR from downgrades, minus churned MRR from cancellations, equals ending MRR.
Customer & Cohort Model
Tracks total customer count by month alongside a cohort-level retention model that shows how each month's new customer additions retain over 12 and 24 months.
Unit Economics
Calculates the fully-loaded cost to acquire a customer and the lifetime value of that customer, which together define the financial efficiency of a SaaS growth engine.
Operating Expenses
A department-by-department operating expense model covering the four standard SaaS cost buckets: cost of revenue (cloud infrastructure, third-party APIs, customer support and customer success headcount, payment processing fees), sales and marketing (AE and SDR salaries and commissions, marketing programs, advertising, events, and sales tools), research and development (engineering and product headcount, developer tools, QA and security costs), and general and administrative (finance, legal, HR, office costs, insurance, and software).
5-Year P&L Summary
An annual summary presenting the full SaaS income statement in the format expected by investors and board members: ARR at period end, revenue (recognized on a monthly basis as service is delivered), COGS and gross profit, gross margin percentage, sales and marketing expense and S&M as a percentage of ARR, R&D expense and R&D as a percentage of ARR, G&A expense, total operating expenses, EBITDA, and net income — side by side for each of the five projected years.
Cash Flow Projection
A monthly cash flow model for year one and annual summary through year five, built around the specific cash dynamics of a SaaS business.
SaaS Pro Forma Template Features
- MRR and ARR waterfall model with new, expansion, contraction, and churned revenue components by month
- Customer cohort retention model calculating logo churn, revenue churn, and net revenue retention (NRR)
- Bottom-up CAC calculation from headcount and marketing spend with LTV:CAC ratio and payback period
- Operating expense model by department (COGS, S&M, R&D, G&A) with role-level headcount inputs
- 5-Year P&L summary with Rule of 40, ARR growth rate, and Magic Number SaaS efficiency metrics
- Monthly cash flow with annual prepayment deferred revenue modeling and runway calculation
How to Use This SaaS Pro Forma Spreadsheet
Start with the Assumptions sheet and work through it section by section. Enter your current MRR (or starting MRR for a pre-revenue business), pricing tier structure, and initial customer count. The most important inputs are your new logo target per month and your gross monthly churn rate — these two numbers drive the entire revenue model. If you're pre-revenue, use your pipeline conversion data or comparable company benchmarks to set a realistic ramp. If you're early-stage with real data, pull your last three months of new logo wins and churned logos, calculate actual monthly churn rate, and use those as your base assumptions. Set your headcount plan in the operating expenses section with hire dates by role — this is where most SaaS founders underestimate cost because a full GTM team hire in months two through four shows up immediately in burn even before those hires generate pipeline.
Once the Assumptions sheet looks right, review the MRR & ARR Build sheet to verify the revenue ramp matches your narrative. Check the NRR calculation on the Customer & Cohort sheet — if it's below 100%, the model is showing that churn is eating expansion, which is the core problem most early-stage SaaS businesses face. Then move to the Unit Economics sheet and look at CAC payback period and LTV:CAC ratio. If payback is above 24 months or LTV:CAC is below 3:1, adjust your CAC assumptions or your churn rate assumptions until the model reflects a fundable unit economics profile — or accept that the current model won't pass investor scrutiny and use that as a signal to change your go-to-market strategy. The 5-Year P&L and Cash Flow sheets should be reviewed last as outputs, not as inputs.
From download to investor-ready SaaS projections in under an hour
Enter your MRR, churn rate, pricing, and headcount plan — the model builds your ARR waterfall, NRR, LTV:CAC ratio, Rule of 40, and 5-year cash flow automatically.
Why Every SaaS Company Needs a Pro Forma
SaaS companies have predictable, recurring revenue — but projecting that revenue accurately requires a model that accounts for how subscription businesses actually grow. A simple top-line growth rate misses the mechanics: new MRR is added from new customers, existing customers expand through seat additions or tier upgrades, some customers downgrade, and some churn entirely. These four components move differently at different growth stages and respond differently to GTM investments. A pro forma built around the SaaS revenue waterfall makes these dynamics explicit, which is why investors expect to see MRR broken out by component rather than presented as a single number growing at a fixed rate.
The unit economics that define a healthy SaaS business are well-established: gross margin of 60–80% (lower for infrastructure-heavy or services-heavy businesses, higher for pure software), net revenue retention at or above 100% (meaning existing customers grow their spend faster than they churn, which is the compounding mechanism that makes SaaS so valuable), CAC payback period under 18 months for SMB-focused products and under 24 months for enterprise, and LTV:CAC ratio above 3:1. The Rule of 40 — revenue growth rate plus EBITDA margin — should approach or exceed 40% for a well-run growth-stage SaaS company. These benchmarks exist because a decade of SaaS IPOs and acquisitions has established what financial profiles produce durable, capital-efficient businesses. A pro forma gives you a structured way to project whether your current trajectory hits those benchmarks, and to model what changes — pricing, churn reduction, sales efficiency — would move the needles that matter.
SaaS Industry at a Glance
Financial templates built for software-as-a-service businesses managing subscription billing, ARR growth, and recurring revenue operations.
Revenue Drivers
- monthly recurring revenue (MRR)
- annual contract value (ACV)
- seat-based or usage-based billing
- professional services and onboarding fees
- add-ons and tier upgrades
Key Cost Categories
- cloud infrastructure (AWS, GCP, Azure)
- employee salaries and benefits (engineering, sales, CS, marketing)
- customer acquisition (ads, events, SDR costs)
- SaaS tools and subscriptions
- payment processing fees
- R&D and product development
Typical Margins
Gross: 60-80% · Net: -5% to 20% depending on growth stage
Seasonality
Relatively flat month-to-month with Q4 spikes from enterprise budget cycles. Annual contract renewals cluster in January and July.
Key Performance Indicators
SaaS Pro Forma Template FAQ
More SaaS Templates
SaaS Balance Sheet Template for Excel
$29
SaaS Budget Template for Excel
$29
SaaS Business Plan Template for Excel
$39
SaaS Cash Flow Template for Excel
$29
SaaS Expense Tracker Template for Excel
$29
SaaS Financial Model Template for Excel
$29
SaaS Income Statement Template for Excel
$29
SaaS Invoice Template for Excel
$29
SaaS KPI Dashboard Template for Excel
$29
SaaS P&L Template for Excel
$29
SaaS Project Budget Template for Excel
$29
SaaS Sales Forecast Template for Excel
$29
SaaS Valuation Template for Excel
$29
SaaS Pro Forma Template
$29