SaaS Sales Forecast Template
Forecast SaaS revenue the right way — MRR waterfall, pipeline conversion, churn modeling, and scenario planning in one Excel template built for subscription businesses.
What's Inside This SaaS Sales Forecast Template
This template includes 7 worksheets, each designed for a specific part of your saas financial workflow:
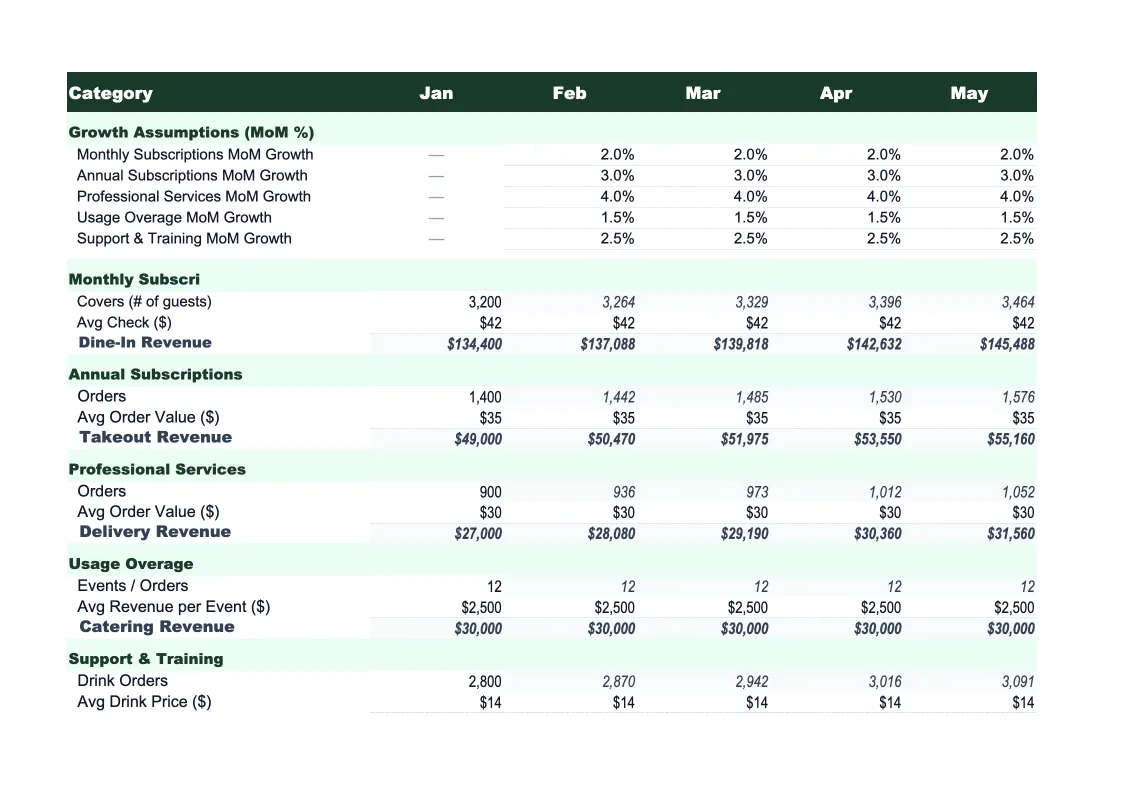
Assumptions
The control panel for the entire model.
MRR Waterfall
The core SaaS revenue build that tracks MRR month by month using the standard waterfall structure: beginning MRR + new MRR + expansion MRR (upsells and seat additions) − contraction MRR − churned MRR = ending MRR.
Pipeline Forecast
A stage-weighted pipeline model that translates your sales funnel into expected revenue.
ARR Summary
Annual recurring revenue view built from the MRR Waterfall.
Actuals vs Forecast
Track your monthly actuals against the original forecast.
Scenario Planner
Three parallel forecasts — base case, upside, and downside — built from separate assumption sets.
Dashboard
Visual summary of the forecast with pre-built charts: MRR growth by component (new, expansion, churn), ARR over time, net revenue retention trend, and pipeline coverage ratio.
SaaS Sales Forecast Template Features
- MRR waterfall tracking new, expansion, contraction, and churned MRR separately
- Pipeline-to-revenue model with stage-weighted close probability
- Net revenue retention (NRR) calculation built into the ARR summary
- Three-scenario planner: base, upside, and downside
- Actuals vs forecast variance tracker for monthly accountability
- Dashboard with MRR growth, ARR trend, and pipeline coverage charts
How to Use This SaaS Sales Forecast Spreadsheet
Start with the Assumptions sheet. Download the file and open it in Excel or upload it to Google Sheets. Enter your current MRR, average contract value by pricing tier, monthly new logo target, and your current gross churn rate. If you're not sure about churn, start with what you can calculate from the past six months — new MRR added minus ending MRR minus beginning MRR. Getting the Assumptions right takes about 20 minutes and everything else flows from there.
Once assumptions are set, move to the Pipeline Forecast sheet and enter your current open opportunities by stage. This is where the bottoms-up sales view meets the top-down MRR model. If your weighted pipeline implies more revenue than your assumptions model, one of them is wrong — and working through that tension is where the real insight lives. Update this sheet weekly or after significant deal movement to keep the forecast current.
15 minutes from download to your first SaaS forecast
Download the template, enter your MRR and assumptions, and get a complete revenue forecast with MRR waterfall, pipeline model, and scenario planning ready to share.
Why SaaS Companies Need a Purpose-Built Sales Forecast
SaaS revenue is fundamentally different from transactional businesses, and a generic sales forecast misses most of what matters. In a subscription model, the forecast isn't just about how many deals you close this month — it's about the stock of recurring revenue you carry in, how much of that erodes through churn and contraction, how much grows through expansion, and how much new MRR you add on top. A restaurant forecasting next month's sales needs different math than a SaaS company modeling its ARR trajectory. The MRR waterfall is the right framework, and most general-purpose forecast templates don't have one.
The metrics that drive SaaS sales forecasting — MRR, ARR, net revenue retention, logo churn, dollar churn — have specific definitions that matter precisely because investors and boards are fluent in them. NRR above 100% means your existing customers are growing faster than they're churning, which is the clearest indicator of product-market fit in a subscription business. Pipeline coverage ratio — how much pipeline you have relative to your quota — is a leading indicator of whether you'll hit next quarter's number. A purpose-built SaaS forecast model handles all of these correctly. A generic spreadsheet requires you to build that structure yourself, which is where errors and inconsistencies creep in.
SaaS Industry at a Glance
Financial templates built for software-as-a-service businesses managing subscription billing, ARR growth, and recurring revenue operations.
Revenue Drivers
- monthly recurring revenue (MRR)
- annual contract value (ACV)
- seat-based or usage-based billing
- professional services and onboarding fees
- add-ons and tier upgrades
Key Cost Categories
- cloud infrastructure (AWS, GCP, Azure)
- employee salaries and benefits (engineering, sales, CS, marketing)
- customer acquisition (ads, events, SDR costs)
- SaaS tools and subscriptions
- payment processing fees
- R&D and product development
Typical Margins
Gross: 60-80% · Net: -5% to 20% depending on growth stage
Seasonality
Relatively flat month-to-month with Q4 spikes from enterprise budget cycles. Annual contract renewals cluster in January and July.
Key Performance Indicators
SaaS Sales Forecast Template FAQ
More SaaS Templates
SaaS Balance Sheet Template for Excel
$29
SaaS Budget Template for Excel
$29
SaaS Business Plan Template for Excel
$39
SaaS Cash Flow Template for Excel
$29
SaaS Expense Tracker Template for Excel
$29
SaaS Financial Model Template for Excel
$29
SaaS Income Statement Template for Excel
$29
SaaS Invoice Template for Excel
$29
SaaS KPI Dashboard Template for Excel
$29
SaaS P&L Template for Excel
$29
SaaS Pro Forma Template for Excel
$29
SaaS Project Budget Template for Excel
$29
SaaS Valuation Template for Excel
$29
More Sales Forecast Templates
SaaS Sales Forecast Template
$29