Pest Control KPI Dashboard Template
Track every metric that matters for a pest control business — recurring revenue, technician productivity, customer retention, and close rates — in one dashboard that updates as you enter data.
What's Inside This Pest Control KPI Dashboard Template
This template includes 5 worksheets, each designed for a specific part of your pest control financial workflow:
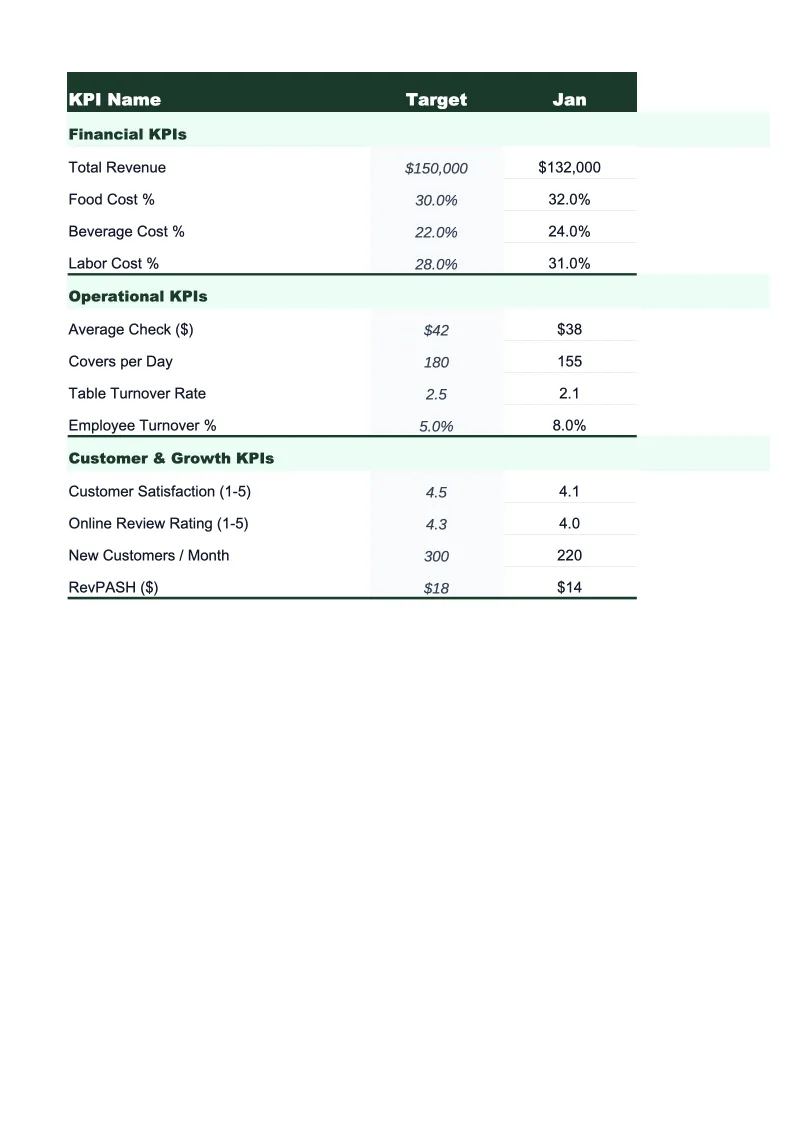
KPI Dashboard
The main overview sheet that pulls together the most critical pest control performance indicators in one view.
Revenue Tracker
Monthly revenue broken down by service type — general pest protection (GPP) contracts, termite treatments and monitoring, bed bug and specialty treatments, rodent control programs, mosquito and tick services, and commercial accounts.
Customer Metrics
Track the customer-side KPIs that determine long-term business health: total active accounts, new accounts added each month, accounts cancelled, and the resulting retention rate.
Technician Performance
Log each technician's monthly stops completed, revenue generated, callbacks (re-treatments required within 30 days), and service hours.
Monthly Trends
A 12-month rolling view of your core KPIs — RMR, active accounts, customer retention, revenue per tech per day, and close rate — plotted as line charts so you can see the direction of each metric over time.
Pest Control KPI Dashboard Features
- Recurring monthly revenue (RMR) tracking split by service type — GPP, termite, specialty, and commercial
- Customer retention rate calculated automatically from new and cancelled accounts each month
- Revenue per technician per day with individual performance breakdowns and company benchmarks
- Close rate tracking for new service proposals and termite inspection conversions
- Color-coded KPI status indicators showing on-target vs. off-target for each metric
- 12-month trend charts for RMR growth, account count, and technician productivity
How to Use This Pest Control KPI Spreadsheet
Setup takes about 20 minutes. Download the file, open it in Excel or Google Sheets, and start with the Revenue Tracker sheet. Enter last month's revenue broken out by service category — GPP contracts, termite, specialty, and commercial. If you have a CRM or route management software, pull the report from there; if not, use your bank deposits or QuickBooks export. Then fill in the Customer Metrics sheet with your opening account count, new accounts added, and cancellations. The KPI Dashboard pulls from both sheets and populates automatically.
Each month, update the three input sheets: Revenue Tracker, Customer Metrics, and Technician Performance. Revenue and customer data should come from your invoicing or CRM system. Technician stops and callbacks can usually be pulled from your route management software (ServiceTitan, PestPac, FieldRoutes, etc.) or logged manually from technician route sheets. The whole monthly update takes about 30 minutes once you have the data ready. Set a recurring calendar reminder for the first Monday of each month.
15 minutes from download to your first KPI snapshot
Download the template, enter last month's numbers, and see your pest control company's retention rate, RMR, and technician productivity in one view.
Why Every Pest Control Company Needs a KPI Dashboard
Pest control is a recurring revenue business at its core, but most operators manage it like a service call business. The distinction matters because the two models have completely different leading indicators. In a call-based business, you watch revenue and job count. In a recurring contract business, you watch RMR growth, customer retention, and average revenue per account — because those numbers predict next year's revenue before it happens. A pest control company with 500 GPP accounts at $75/month has $37,500 in guaranteed monthly revenue regardless of how many new calls come in. That predictability is where the business value is, and it's what this dashboard is built to track.
The KPIs that matter most in pest control break into three categories. Revenue quality: what percentage of your total revenue is recurring versus one-time treatments? Companies with 70%+ recurring revenue trade at higher multiples and weather slow seasons without cash flow stress. Customer health: what's your retention rate and how is it trending? Industry benchmarks for well-run companies range from 80–90% annual retention on residential accounts. Anything below 75% usually signals a service quality or pricing issue worth investigating. And operational efficiency: revenue per technician per day — the single number that determines whether adding another tech improves your margin or dilutes it.
Pest Control Industry at a Glance
Financial templates built for pest control businesses — from solo operators to multi-route companies. Pre-loaded with recurring contract, termite, and specialty treatment categories.
Revenue Drivers
- Recurring GPP contracts
- Termite treatments and monitoring
- Bed bug and specialty treatments
- Rodent control and exclusion
- Mosquito and tick programs
- Commercial pest control contracts
Key Cost Categories
- Technician wages and payroll taxes
- Pesticides, rodenticides, and materials
- Vehicle fuel and fleet maintenance
- Liability and commercial auto insurance
- Pesticide applicator license fees
- Route management and CRM software
Typical Margins
Gross: 45-60% · Net: 10-20%
Seasonality
Spring through fall drives new contract sign-ups and mosquito/tick program revenue; core GPP and commercial contracts provide year-round base revenue; termite swarm season (March–June) is a major driver of new termite treatment sales.
Key Performance Indicators
Pest Control KPI Dashboard Template FAQ
More Pest Control Templates
Pest Control Balance Sheet Template for Excel
$29
Pest Control Budget Template for Excel
$29
Pest Control Business Plan Template for Excel
$39
Pest Control Cash Flow Template for Excel
$29
Pest Control Expense Tracker Template for Excel
$29
Pest Control Financial Model Template for Excel
$29
Pest Control Income Statement Template for Excel
$29
Pest Control Invoice Template for Excel
$29
Pest Control P&L Template for Excel
$29
Pest Control Pro Forma Template for Excel
$29
Pest Control Project Budget Template for Excel
$29
Pest Control Sales Forecast Template for Excel
$29
Pest Control Business Valuation Template for Excel
$29
More KPI Dashboard Templates
Pest Control KPI Dashboard Template
$29