Pest Control Sales Forecast Template
Project your pest control company's revenue by contract type, service category, and season — with recurring account growth, termite treatment cycles, and actual vs forecast tracking built in.
What's Inside This Pest Control Sales Forecast Template
This template includes 6 worksheets, each designed for a specific part of your pest control financial workflow:
Assumptions
The driver hub for your entire forecast.
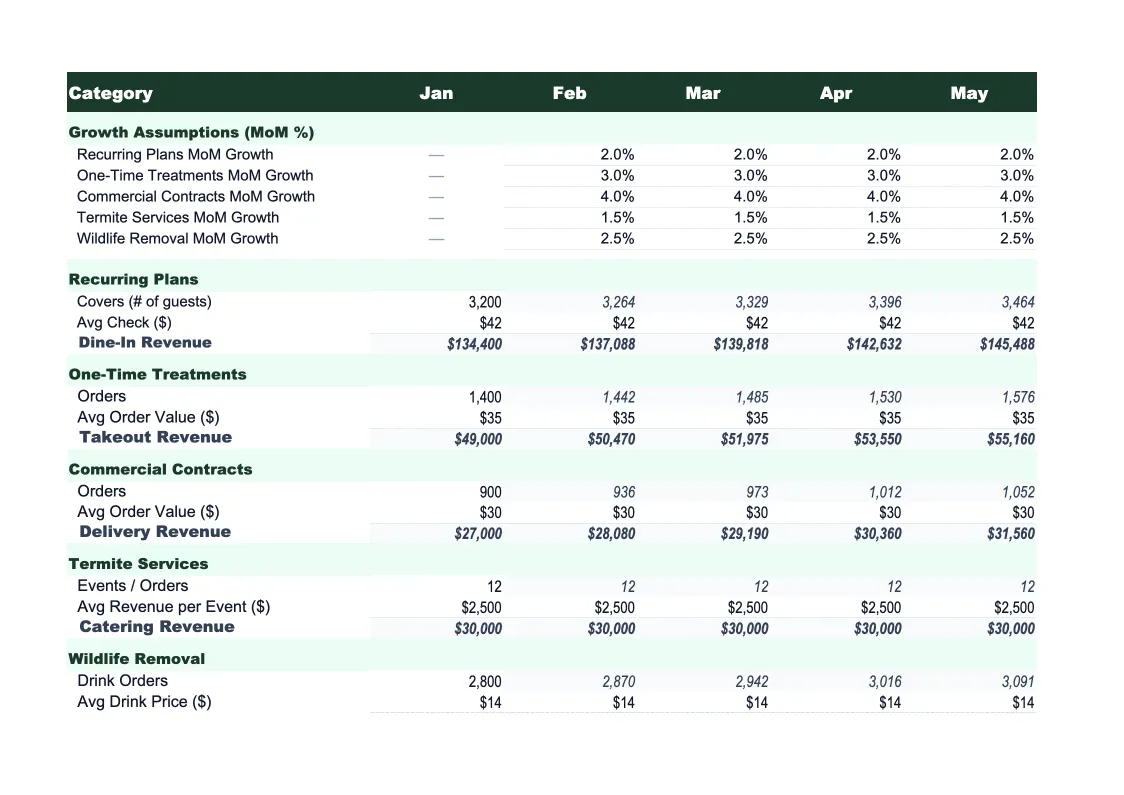
Monthly Forecast
The core projection sheet showing 12 months of projected revenue split across four categories: recurring GPP contract revenue (active accounts × monthly rate), termite treatment and monitoring revenue (seasonally weighted to reflect swarm season), one-time and specialty service revenue (bed bug treatments, rodent exclusion, mosquito/tick programs), and commercial account revenue.
Annual Summary
A full-year rollup showing total projected revenue by service category for the forecast period, month by month and in aggregate.
Actual vs Forecast
Enter your actual monthly revenue figures alongside your projections and the sheet calculates dollar and percentage variance for each service category.
Scenario Comparison
Three side-by-side scenarios — base case, upside, and downside — built from different assumption sets.
Dashboard
A visual summary of your forecast with pre-built charts: monthly revenue by category (stacked bar), active account growth trend line, recurring vs one-time revenue split over the forecast period, and actual vs forecast comparison.
Pest Control Sales Forecast Template Features
- Driver-based model: active accounts × monthly rate with rolling attrition
- Revenue split by GPP contracts, termite treatments, specialty services, and commercial
- Seasonal adjustment factors for swarm season and mosquito/tick program peaks
- Three-scenario comparison (base, upside, downside) for staffing and planning decisions
- Actual vs forecast tracker with active account count reconciliation
- Recurring revenue trend chart showing RMR growth month over month
How to Use This Pest Control Sales Forecast Spreadsheet
Start with the Assumptions sheet — it drives everything else. Enter your current active account count, average monthly rate per GPP account (typically $40–$60 for residential, $150–$400 for commercial), your monthly new account sign-up rate, and your attrition rate. Then set your termite treatment average ticket and a seasonal weight for swarm season months. If you have last year's route management or CRM data, use it as your baseline — most pest control operators find the initial setup takes 20–30 minutes and produces a first-pass forecast that's within 10–15% of actuals without any further tweaking.
Once your assumptions are set, review the Monthly Forecast sheet to check whether the projections feel realistic. Pay close attention to how the active account count rolls forward — if your assumed attrition rate is 1.5% per month and your new sign-up rate is 20 accounts per month, the model will show you whether your account base is actually growing or treading water. Fill out the Scenario Comparison sheet early too: a downside scenario with 2.5% attrition and a weak termite season is a useful stress test when deciding whether to hire another technician or take on a vehicle lease.
15 minutes from download to your first revenue forecast
Download the template, plug in your account count and monthly rate, and see your pest control company's projected revenue — month by month, service category by category.
Why Every Pest Control Company Needs a Sales Forecast Template
Pest control revenue is split between two fundamentally different dynamics: recurring contract revenue that compounds slowly and predictably, and seasonal one-time revenue that swings with weather, pests, and inspection volume. Most pest control operators underestimate how much the recurring side dominates long-term revenue — a company with 500 GPP accounts at $50/month is generating $300K in annual recurring revenue before a single technician books a termite job. A sales forecast makes that distinction explicit, showing you how your total revenue is composed and whether you're building a stable recurring base or depending too heavily on seasonal one-time services.
For pest control companies, the highest-leverage forecast variables are attrition rate and new account acquisition pace. Attrition in a well-run operation runs 1–2% per month; higher than that signals a customer satisfaction problem or pricing mismatch. New account acquisition varies significantly by season — spring and early summer drive the majority of new GPP sign-ups as homeowners see ant and tick activity. Termite treatment revenue concentrates heavily in March through June during swarm season, with a secondary wave in late summer in warmer markets. A well-built forecast models these seasonal patterns explicitly rather than spreading revenue evenly across 12 months, because the difference shows up in real cash flow and staffing needs.
Pest Control Industry at a Glance
Financial templates built for pest control businesses — from solo operators to multi-route companies. Pre-loaded with recurring contract, termite, and specialty treatment categories.
Revenue Drivers
- Recurring GPP contracts
- Termite treatments and monitoring
- Bed bug and specialty treatments
- Rodent control and exclusion
- Mosquito and tick programs
- Commercial pest control contracts
Key Cost Categories
- Technician wages and payroll taxes
- Pesticides, rodenticides, and materials
- Vehicle fuel and fleet maintenance
- Liability and commercial auto insurance
- Pesticide applicator license fees
- Route management and CRM software
Typical Margins
Gross: 45-60% · Net: 10-20%
Seasonality
Spring through fall drives new contract sign-ups and mosquito/tick program revenue; core GPP and commercial contracts provide year-round base revenue; termite swarm season (March–June) is a major driver of new termite treatment sales.
Key Performance Indicators
Pest Control Sales Forecast Template FAQ
More Pest Control Templates
Pest Control Balance Sheet Template for Excel
$29
Pest Control Budget Template for Excel
$29
Pest Control Business Plan Template for Excel
$39
Pest Control Cash Flow Template for Excel
$29
Pest Control Expense Tracker Template for Excel
$29
Pest Control Financial Model Template for Excel
$29
Pest Control Income Statement Template for Excel
$29
Pest Control Invoice Template for Excel
$29
Pest Control KPI Dashboard Template for Excel
$29
Pest Control P&L Template for Excel
$29
Pest Control Pro Forma Template for Excel
$29
Pest Control Project Budget Template for Excel
$29
Pest Control Business Valuation Template for Excel
$29
More Sales Forecast Templates
Pest Control Sales Forecast Template
$29