Pest Control Financial Model Template
Model your pest control company's full financial picture — recurring contract growth, technician labor costs, termite treatment revenue, and 3-year cash flow projections — in one connected workbook built for the pest management industry.
What's Inside This Pest Control Financial Model
This template includes 6 worksheets, each designed for a specific part of your pest control financial workflow:
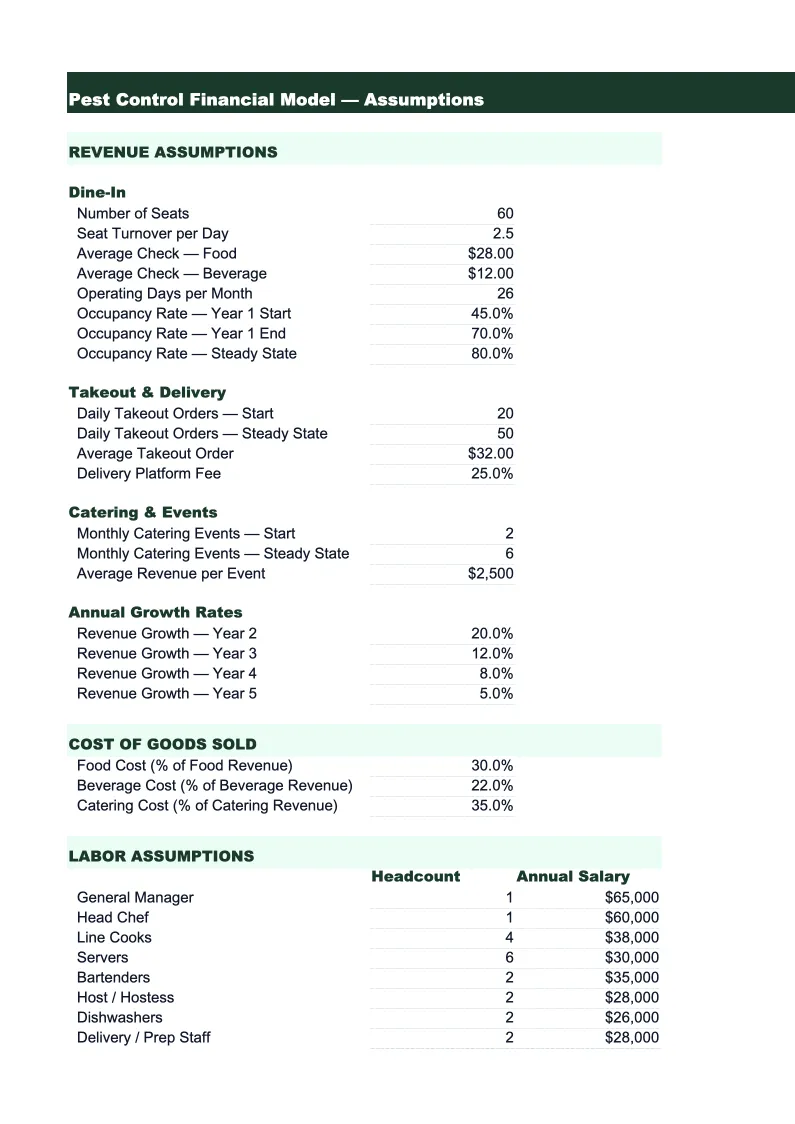
Assumptions
The control panel for the entire model.
Revenue Projections
A month-by-month revenue build over 36 months, broken out by service line: recurring GPP contracts (billed monthly or quarterly), termite treatments and monitoring agreements, bed bug and specialty treatments, rodent control and exclusion jobs, mosquito and tick programs (seasonal), and commercial pest control contracts.
P&L
A 36-month profit and loss statement built around the pest control cost structure.
Cash Flow
A monthly cash flow statement that reflects how pest control revenues and expenses actually hit your bank account.
Balance Sheet
A simplified projected balance sheet showing assets (cash, accounts receivable, equipment and vehicle fleet at book value), liabilities (vehicle loans, any equipment financing, insurance payables), and owner's equity at each year-end.
KPI Dashboard
A single-page visual summary of the metrics that matter in the pest management business.
Pest Control Financial Model Features
- Recurring contract revenue model with monthly compounding growth, new sign-up rate, and churn rate inputs
- Revenue by service line: GPP recurring, termite treatments, bed bug/specialty, rodent, mosquito/tick, and commercial
- Termite swarm season and mosquito program seasonality pre-configured with adjustable monthly multipliers
- Technician labor cost model based on field hours per route, headcount, and wage rates
- 36-month cash flow with billing cycle modeling (monthly vs. quarterly GPP contracts) and minimum cash alerts
- KPI dashboard tracking RMR, customer retention rate, ARPA, and revenue per technician per day
How to Use This Pest Control Financial Spreadsheet
Start in the Assumptions sheet — it's the only sheet you need to edit to get a working model. Enter your current technician count, your average GPP contract value, how many recurring accounts you have today, and your monthly new sign-up and churn rates. Then enter your pricing and rough job volume for one-time services: termite treatments, bed bug jobs, rodent exclusion, and mosquito program enrollments. Add your technician labor rate, pesticide material cost as a percentage of revenue, vehicle costs per route, and fixed overhead. Most pest control operators can fill this in within 20 minutes using last year's job management software reports or QuickBooks data.
Once your assumptions are in, check the Revenue Projections sheet to confirm the recurring contract growth curve looks realistic. The model grows your account base month by month using your sign-up and churn inputs, so you'll quickly see whether your current acquisition pace is enough to hit your revenue targets. Review the seasonal pattern on termite and mosquito revenue — the template defaults to national swarm season timing, but if your market peaks differently, adjust the monthly multipliers in the Assumptions sheet. Then review the P&L gross margin; if it's outside the 45–60% range typical for pest control, check your technician labor or material cost inputs.
15 minutes from download to your first pest control projection
Download the template, enter your account count and technician costs, and see your pest control company's full financial picture — recurring revenue growth, margins, and cash flow — for the next 3 years.
Why Pest Control Companies Need a Financial Model
Pest control is one of the few service businesses that generates genuinely recurring revenue — and that changes what a financial model needs to do. A typical GPP (general pest protection) contract bills the customer monthly or quarterly as long as they stay, which means your revenue for next year is largely determined by how many accounts you keep this year and how many new ones you add. The model captures this compounding dynamic explicitly: enter your starting account count, your monthly new sign-up rate, and your churn rate, and the revenue projections show exactly how your recurring base grows or stagnates over 36 months. For most pest control operators, improving customer retention by even a few percentage points has a larger revenue impact than winning an equivalent number of new accounts.
On top of recurring GPP revenue, pest control companies have significant seasonal one-time revenue that a generic model won't capture correctly. Termite swarm season — roughly March through June in most of the country — is the primary driver of new termite treatment and monitoring agreement sales. Mosquito and tick programs enroll in April and May and run through October. These seasonal spikes matter because they often fund your cash reserves during slower winter months, and a model that doesn't account for them will both understate spring cash inflows and fail to flag how lean late fall can get. The template pre-configures these seasonal patterns, and you can fine-tune the multipliers for your specific geography and climate.
Pest Control Industry at a Glance
Financial templates built for pest control businesses — from solo operators to multi-route companies. Pre-loaded with recurring contract, termite, and specialty treatment categories.
Revenue Drivers
- Recurring GPP contracts
- Termite treatments and monitoring
- Bed bug and specialty treatments
- Rodent control and exclusion
- Mosquito and tick programs
- Commercial pest control contracts
Key Cost Categories
- Technician wages and payroll taxes
- Pesticides, rodenticides, and materials
- Vehicle fuel and fleet maintenance
- Liability and commercial auto insurance
- Pesticide applicator license fees
- Route management and CRM software
Typical Margins
Gross: 45-60% · Net: 10-20%
Seasonality
Spring through fall drives new contract sign-ups and mosquito/tick program revenue; core GPP and commercial contracts provide year-round base revenue; termite swarm season (March–June) is a major driver of new termite treatment sales.
Key Performance Indicators
Pest Control Financial Model FAQ
More Pest Control Templates
Pest Control Balance Sheet Template for Excel
$29
Pest Control Budget Template for Excel
$29
Pest Control Business Plan Template for Excel
$39
Pest Control Cash Flow Template for Excel
$29
Pest Control Expense Tracker Template for Excel
$29
Pest Control Income Statement Template for Excel
$29
Pest Control Invoice Template for Excel
$29
Pest Control KPI Dashboard Template for Excel
$29
Pest Control P&L Template for Excel
$29
Pest Control Pro Forma Template for Excel
$29
Pest Control Project Budget Template for Excel
$29
Pest Control Sales Forecast Template for Excel
$29
Pest Control Business Valuation Template for Excel
$29
More Financial Model Templates
Pest Control Financial Model Template
$29