Pest Control P&L Template
Track your pest control company's revenue by service type, manage technician labor and chemical costs, and see your true net margin with a P&L built specifically for pest operators.
What's Inside This Pest Control P&L Template
This template includes 4 worksheets, each designed for a specific part of your pest control financial workflow:
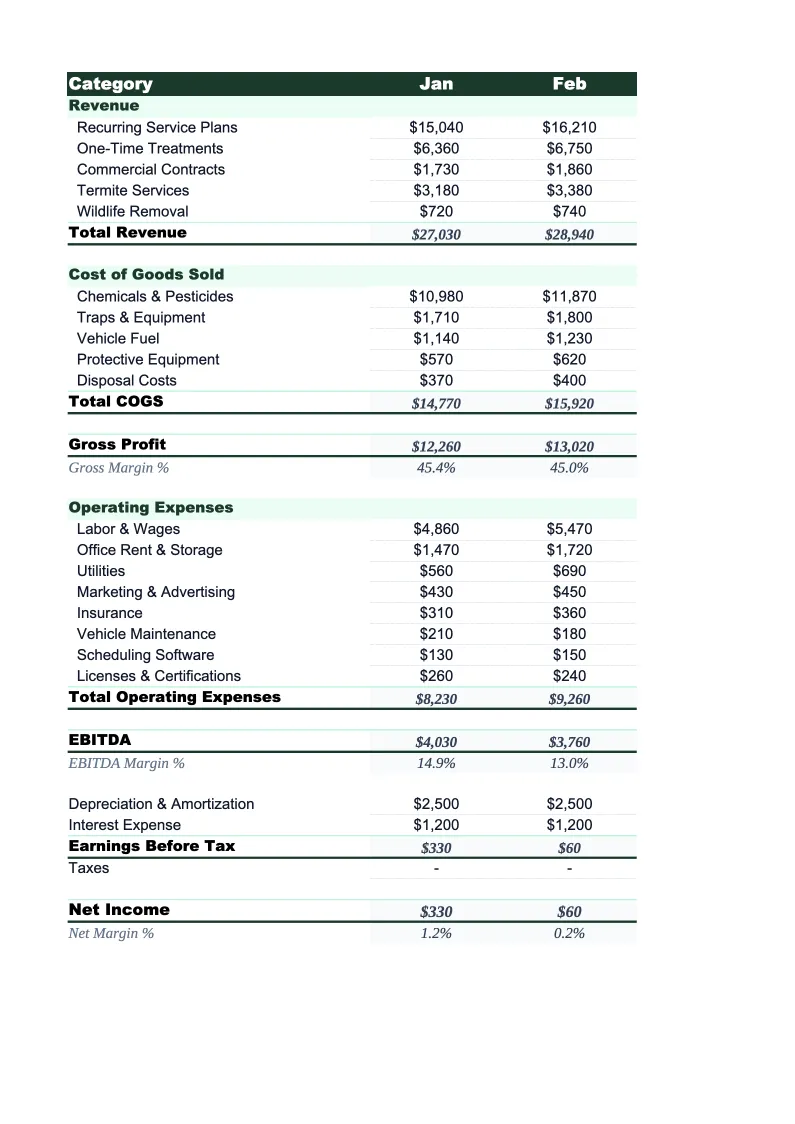
Monthly P&L
The core worksheet where you record each month's revenue and expenses.
Annual Summary
A 12-month view that pulls from each monthly sheet automatically.
Service Mix Analysis
A dedicated sheet for analyzing revenue and profitability by service category.
Dashboard
A visual summary with pre-built charts and KPI tiles covering the metrics that matter most to pest control operations.
Pest Control P&L Template Features
- Revenue split by GPP contracts, termite treatments, bed bug, rodent, mosquito/tick, and commercial accounts
- Technician labor tracked separately from chemical, vehicle, insurance, and software costs
- Service mix analysis with per-category revenue, account counts, and chemical cost ratios
- Recurring monthly revenue (RMR) calculation to track contract base versus one-time work
- Monthly and annual P&L with gross margin and net income auto-calculations
- Dashboard with charts for labor %, chemical cost %, and monthly net income trends
How to Use This Pest Control P&L Spreadsheet
Download the .xlsx file and open it in Excel or Google Sheets — no macros or plugins required. Start with the Monthly P&L sheet and review the pre-loaded revenue and expense categories. Most pest control operators keep the structure as-is and adjust a handful of line items to match their service mix — for example, an operator without a mosquito program would remove that line, while one doing significant commercial work might split that revenue into subcategories by account size. Setup takes about 15 minutes.
Enter your current month's revenue by service type — GPP contract billings, termite treatment revenue, bed bug and specialty treatment income, rodent exclusion work, mosquito and tick program fees, and commercial account billings. Then enter expenses using your payroll records, chemical purchase receipts, fuel and fleet costs, insurance invoices, and software subscription charges. The Service Mix Analysis sheet is worth filling out at the same time: enter your account counts and average revenue per category, and the sheet calculates your RMR and chemical cost ratios by service type — the numbers that tell you which services are actually profitable.
15 minutes from download to your first P&L
Download the template, plug in your numbers, and see your pest control company's full financial picture — monthly P&L, service mix analysis, and annual summary included.
Why Every Pest Control Company Needs a P&L Template
Pest control company finances are built around two fundamentally different revenue streams that need to be tracked separately to understand the business. Recurring GPP contracts — monthly or quarterly service agreements for general pest prevention — carry high margins and predictable cash flow, but relatively low revenue per visit. Termite treatments, bed bug jobs, and specialty services generate larger one-time revenues but carry higher chemical and labor costs and require different sales and scheduling workflows. Companies that lump all service revenue together in their P&L often can't tell whether their growth is coming from high-margin recurring accounts or lower-margin treatment work. Industry gross margins typically run 45–60%, with net margins of 10–20% for well-run operations.
The cost categories that move fastest in a pest control P&L are technician labor, chemicals, and fleet costs. Technician labor typically runs 30–45% of revenue, making it the single largest expense line. Chemical costs vary significantly by service type — general pest control routes run 5–10% of revenue in chemical costs, while termite liquid treatments and bed bug heat or chemical jobs can run 15–25% in materials alone. Fleet costs — fuel, maintenance, and commercial auto insurance — typically represent 8–15% of revenue and scale directly with route density and technician count. Tracking chemical costs as a percentage of each service category, not just total revenue, is what lets you catch a margin problem before it spreads across the whole business.
Pest Control Industry at a Glance
Financial templates built for pest control businesses — from solo operators to multi-route companies. Pre-loaded with recurring contract, termite, and specialty treatment categories.
Revenue Drivers
- Recurring GPP contracts
- Termite treatments and monitoring
- Bed bug and specialty treatments
- Rodent control and exclusion
- Mosquito and tick programs
- Commercial pest control contracts
Key Cost Categories
- Technician wages and payroll taxes
- Pesticides, rodenticides, and materials
- Vehicle fuel and fleet maintenance
- Liability and commercial auto insurance
- Pesticide applicator license fees
- Route management and CRM software
Typical Margins
Gross: 45-60% · Net: 10-20%
Seasonality
Spring through fall drives new contract sign-ups and mosquito/tick program revenue; core GPP and commercial contracts provide year-round base revenue; termite swarm season (March–June) is a major driver of new termite treatment sales.
Key Performance Indicators
Pest Control P&L Template FAQ
More Pest Control Templates
Pest Control Balance Sheet Template for Excel
$29
Pest Control Budget Template for Excel
$29
Pest Control Business Plan Template for Excel
$39
Pest Control Cash Flow Template for Excel
$29
Pest Control Expense Tracker Template for Excel
$29
Pest Control Financial Model Template for Excel
$29
Pest Control Income Statement Template for Excel
$29
Pest Control Invoice Template for Excel
$29
Pest Control KPI Dashboard Template for Excel
$29
Pest Control Pro Forma Template for Excel
$29
Pest Control Project Budget Template for Excel
$29
Pest Control Sales Forecast Template for Excel
$29
Pest Control Business Valuation Template for Excel
$29
Pest Control P&L Template
$29