Pest Control Pro Forma Template
Project revenue, costs, and growth for your pest control business — built around recurring contract economics, termite seasonality, and technician productivity.
What's Inside This Pest Control Pro Forma Template
This template includes 6 worksheets, each designed for a specific part of your pest control financial workflow:
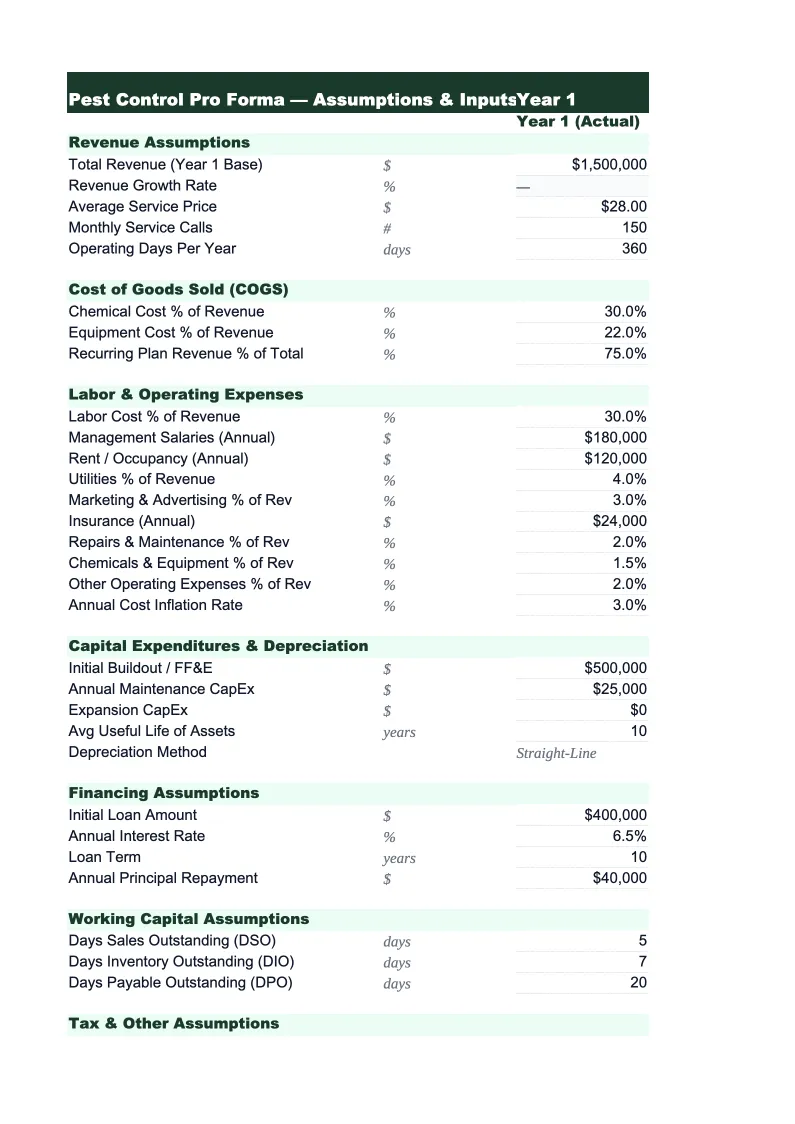
Assumptions
The control panel for the entire model.
Revenue Projections
A five-year monthly revenue breakdown organized by service type: recurring general pest protection (GPP) contracts, termite treatment and monitoring programs, bed bug and specialty treatments, rodent control and exclusion services, mosquito and tick programs, and commercial account revenue.
Expense Projections
A full cost projection covering every major expense category in pest control: technician wages and payroll taxes, pesticides and rodenticides, equipment and safety gear, vehicle fuel and fleet maintenance, commercial auto and liability insurance, pesticide applicator license fees, route management and CRM software, and general and administrative costs.
P&L Summary
A clean five-year projected income statement organized in the standard format pest control businesses use when presenting to lenders or investors: gross revenue by service category, total COGS (chemicals, direct labor, vehicle costs), gross profit and gross margin, operating expenses by category, EBITDA, and net income.
Cash Flow Projection
A monthly cash flow view for years one and two, then annual for years three through five.
KPI Dashboard
A single-page summary of the metrics that buyers, lenders, and operators use to evaluate pest control businesses.
Pest Control Pro Forma Template Features
- Revenue modeled by service type: GPP contracts, termite, specialty, commercial
- Technician capacity constraints built into the growth model
- Termite swarm-season revenue spikes modeled by month
- Recurring Monthly Revenue (RMR) and ARPA tracked throughout projections
- Customer retention and churn rate assumptions drive contract renewal math
- Acquisition valuation estimate based on pest control industry revenue multiples
How to Use This Pest Control Pro Forma Spreadsheet
Start with the Assumptions sheet — that's where every input lives. Enter your current technician count, the average number of accounts each tech handles, your residential monthly contract rate, commercial account average, and retention rate. If you're projecting a new business, use industry benchmarks as placeholders: 150–200 accounts per full-time technician, $45–65/month for residential GPP, and 75–80% first-year retention. The model will build from there. Most operators have all the data they need from their route management software and can fill in the Assumptions sheet in under 20 minutes.
Once assumptions are set, walk through the Revenue Projections sheet to make sure each service line looks right for your market. If termite is a major part of your business, check that the swarm-season spike months (typically March through June) are weighted correctly. If you run a mosquito program, toggle it on and enter your average ticket. The Expense Projections sheet is mostly automated, but review the labor section — if your technician wages or payroll taxes differ from the defaults, update those inputs. The P&L Summary and Cash Flow sheets update automatically.
15 minutes from download to your first pest control projection
Download the template, enter your accounts and technician count, and see five years of revenue, margins, and RMR growth projected out.
Why Every Pest Control Business Needs a Pro Forma
Pest control is a recurring-revenue business disguised as a service business, and that distinction matters when you're planning for growth or preparing for a sale. The value in a pest control company isn't the trucks or the chemicals — it's the book of recurring contracts and the retention rate behind them. A solo operator with 300 accounts renewing at 82% is worth meaningfully more than a larger company with 500 accounts churning at 65%, because the math on lifetime customer value compounds fast. A pro forma makes that dynamic visible so you can manage toward it.
The financial model for a pest control business has a structure that generic templates miss. Revenue doesn't grow in a straight line — it spikes during termite swarm season (March through June in most markets), ramps during spring when new homeowners call, and flattens in winter for residential while commercial holds steady year-round. Labor costs are technician-driven: adding a route requires adding a tech, and a new technician takes 90–180 days to build a full book. Materials run at 5–12% of revenue depending on service mix — termite work uses more chemical per job, rodent exclusion uses materials heavily. A pest control pro forma needs to model these dynamics explicitly, not just project last year's numbers forward.
Pest Control Industry at a Glance
Financial templates built for pest control businesses — from solo operators to multi-route companies. Pre-loaded with recurring contract, termite, and specialty treatment categories.
Revenue Drivers
- Recurring GPP contracts
- Termite treatments and monitoring
- Bed bug and specialty treatments
- Rodent control and exclusion
- Mosquito and tick programs
- Commercial pest control contracts
Key Cost Categories
- Technician wages and payroll taxes
- Pesticides, rodenticides, and materials
- Vehicle fuel and fleet maintenance
- Liability and commercial auto insurance
- Pesticide applicator license fees
- Route management and CRM software
Typical Margins
Gross: 45-60% · Net: 10-20%
Seasonality
Spring through fall drives new contract sign-ups and mosquito/tick program revenue; core GPP and commercial contracts provide year-round base revenue; termite swarm season (March–June) is a major driver of new termite treatment sales.
Key Performance Indicators
Pest Control Pro Forma Template FAQ
More Pest Control Templates
Pest Control Balance Sheet Template for Excel
$29
Pest Control Budget Template for Excel
$29
Pest Control Business Plan Template for Excel
$39
Pest Control Cash Flow Template for Excel
$29
Pest Control Expense Tracker Template for Excel
$29
Pest Control Financial Model Template for Excel
$29
Pest Control Income Statement Template for Excel
$29
Pest Control Invoice Template for Excel
$29
Pest Control KPI Dashboard Template for Excel
$29
Pest Control P&L Template for Excel
$29
Pest Control Project Budget Template for Excel
$29
Pest Control Sales Forecast Template for Excel
$29
Pest Control Business Valuation Template for Excel
$29
Pest Control Pro Forma Template
$29